Tropical savanna climate or tropical wet and dry climate is a tropical climate sub-type that corresponds to the Köppen climate classification categories Aw (for a dry "winter") and As (for a dry "summer"). The driest month has less than 60 mm (2.4 in) of precipitation and also less than mm of precipitation.[1]: 200–1
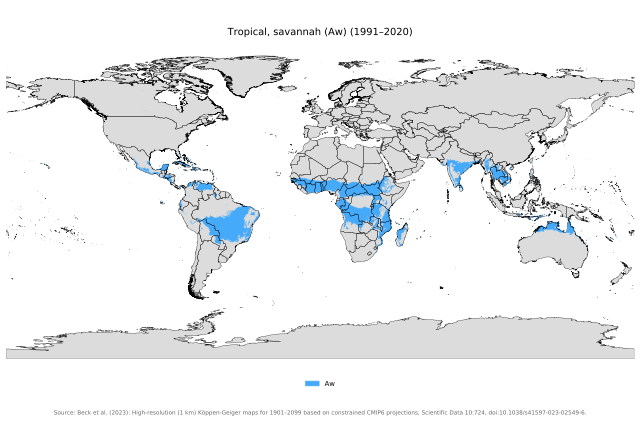
Worldwide zones of Tropical savanna climate (Aw/As)
This latter fact is in a direct contrast to a tropical monsoon climate, whose driest month sees less than 60 mm (2.4 in) of precipitation but has more than of precipitation. In essence, a tropical savanna climate tends to either see less overall rainfall than a tropical monsoon climate or have more pronounced dry season(s). It is impossible for a tropical savanna climate to have more than 2,500 mm (98 in) as such would result in a negative value in that equation.
In tropical savanna climates, the dry season can become severe, and often drought conditions prevail during the course of the year. Tropical savanna climates often feature tree-studded grasslands due to its dryness, rather than thick jungle. It is this widespread occurrence of tall, coarse grass (called savanna) which has led to Aw and As climates often being referred to as the tropical savanna. However, there is some doubt whether tropical grasslands are climatically induced. Additionally, pure savannas, without trees, are the exception rather than the rule.
There are generally four types of tropical savanna climates:
Distinct wet and dry seasons of relatively equal duration. Most of the region's annual rainfall is experienced during the wet season and very little precipitation falls during the dry season.
A lengthy dry season and a relatively short wet season. This version features seven or more dry season months and five or fewer wet season months. There are more variations within this version:
On one extreme, the region receives just enough precipitation during the short wet season to preclude it from a semi-arid climate classification. This drier variation of the tropical savanna climate is typically found adjacent to regions with hot semi-arid (BSh) climates, such as seen in places like India, the Sahel region in Africa and Brazil.
On the other extreme, the climate features a lengthy dry season followed by a short but extremely rainy wet season. However, regions with this variation of the climate do not experience enough rainfall during the wet season to qualify as a tropical monsoon climate (Am). These can be found near tropical monsoon climates such as in Asia, Africa and the Americas.
A lengthy, moderately wet season and a relatively short dry season. This version features seven or more wet season months and five or fewer dry season months. This version's precipitation pattern is similar to precipitation patterns observed in some tropical monsoon climates (as well as subhumid temperate climates farther poleward) but does not experience enough rainfall during the wet season to be classified as such, while the rainfall in the dry season is just low enough to preclude a tropical rainforest climate (Af) and temperatures in the winter months are warm enough to preclude a humid subtropical climate (Cwa) or subtropical highland climate (Cwb) classification. This is often found near the poleward margins of the tropical savanna climates.
A dry season with a noticeable amount of rainfall followed by a rainy wet season. In essence, this version mimics the precipitation patterns more commonly found in a tropical monsoon climate, but do not receive enough precipitation during either the dry season or the year to be classified as such.
Dry forest in ThailandSavanna in South Sudan
Tropical savanna climates are most commonly found in Africa, Asia, Central America, and South America. The climate is also prevalent in sections of northern Australia, the Pacific Islands, in extreme southern North America in south Florida, and some islands in the Caribbean. Most places that have this climate are found at the outer margins of the tropical zone, but occasionally an inner-tropical location (e.g., San Marcos, Antioquia, Colombia) also qualifies. Similarly, the Caribbean coast, eastward from the Gulf of Urabá on the Colombia – Panamá border to the Orinocoriver delta, on the Atlantic Ocean (ca. 4,000 km (2,485 mi)), have long dry periods (the extreme is the BSh climate (see below), characterized by very low, unreliable precipitation, present, for instance, in extensive areas in the Guajira, and Coro, western Venezuela, the northernmost peninsulas in South America, which receive <300 mm (11.8 in) total annual precipitation, practically all in two or three months). This condition extends to the Lesser Antilles and Greater Antilles forming the Circumcaribbean dry belt. The length and severity of the dry season diminishes inland (southward); at the latitude of the Amazon river—which flows eastward, just south of the equatorial line—the climate is Af. East from the Andes, between the arid Caribbean and the ever-wet Amazon, are the Orinoco river Llanos or savannas, from where this climate takes its name.
Sometimes As is used in place of Aw if the dry season occurs during the time of higher sun and longer days. This is typically due to a rain shadow effect that cuts off ITCZ-triggered summer precipitation in a tropical area while winter precipitation remains sufficient to preclude a hot semi-arid climate (BSh) and temperatures in the summer months are warm enough to preclude a Mediterranean climate (Csa/Csb) classification. This is the case East Africa (Mombasa, Kenya, Somalia), Sri Lanka (Trincomalee) and coastal regions of Northeastern Brazil (from São Luís[2] through Natal to Maceió), for instance. The difference between "summer" and "winter" in such tropical locations is usually so slight that a distinction between an As and Aw climate is trivial. In most places that have tropical wet and dry climates, however, the dry season occurs during the time of lower sun and shorter days because of reduction of or lack of convection, which in turn is due to the meridional shifts of the Intertropical Convergence Zone during the entire course of the year, based on which hemisphere the location sits.
^Smart, Matthew P (2019). Thought, Action; Impact: Modes of Presentation to Enable an Immersive Reader-Response (Thesis). Queensland University of Technology. doi:10.5204/thesis.eprints.127474.
 Article Images


.jpg)