Net international investment position
Contributors to Wikimedia projects
 Article Images
The net international investment position (NIIP) is the difference between the external financial assets and liabilities of a country.[1] External debt of a country includes government debt and private debt. External assets publicly and privately held by a country's legal residents are also taken into account when calculating NIIP.[2] Commodities and currencies tend to follow a cyclical pattern of significant valuation changes, which is also reflected in NIIP.

The International investment position (IIP) of a country is a financial statement of the value and composition of its external financial assets and liabilities. A positive NIIP value indicates that a nation is a creditor nation, while a negative value indicates that it is a debtor nation.
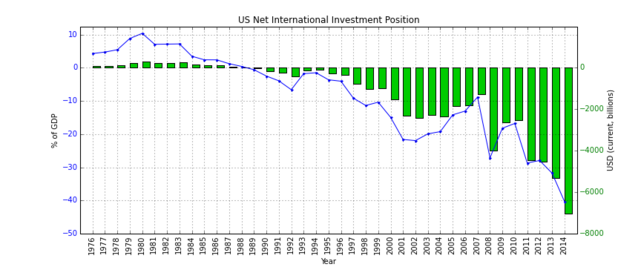
In 1980, the United States net international-creditor position was bigger than the total net creditor-positions of all the other countries in the world.[3] Only six years later, in 1986, when the nation’s international investment position was at a year-end negative $107.4 billion, the U.S. became a net-debtor nation for the first time since 1914, when its nominal debt had reached $2 billion.[4] By 1990, the U.S. was the world's largest debtor[3] By end-2020, the country’s net international-investment position was a negative $14 trillion, an amount representing how much more the U.S. owed to the rest of the world than the rest of the world owed to the U.S.[5] At the end of 2022, it stood at a negative $16 trillion.[6]
List of countries and regions by net international investment position (NIIP)
| Countries and regions | Date | NIIP[7] (US$ millions) |
Date | GDP[8] (US $millions) |
Date | NIIP (% GDP) |
|---|---|---|---|---|---|---|
| Albania | 2021Q1 | -9,028 | 2021 | 17,138 | 2019 | −52.1 |
| Andorra | 2020 | +7,658[9][10] | 2020 | 2,890[10] | 2022 | 339.9[11] |
| Argentina | 2021Q1 | +128,627 | 2021 | 418,150 | 2019 | 26.3 |
| Armenia | 2021Q1 | -10,124 | 2021 | 12,251 | 2019 | −73.1 |
| Australia | 2021Q1 | -664,900 | 2021 | 1,617,543 | 2021 | −41.1 |
| Austria | 2021Q1 | +58,662 | 2021 | 481,796 | 2023Q2 | 17.6[12] |
| Bangladesh | 2021Q1 | -44,673 | 2021 | 352,908 | 2019 | −13.5 |
| Belarus | 2021Q1 | -31,417 | 2021 | 60,725 | 2021 | −51.7 |
| Belgium | 2021Q1 | +263,132 | 2021 | 578,996 | 2023Q2 | 59.1[12] |
| Bhutan | 2021Q1 | -2,585 | 2021 | 2,480 | 2021 | −104.2 |
| Brazil | 2021Q1 | -460,181 | 2021 | 1,491,772 | 2019 | −39.6 |
| Bulgaria | 2021Q1 | -17,228 | 2021 | 77,782 | 2023Q2 | −13.2[12] |
| Cambodia | 2021Q1 | -25,658 | 2021 | 27,239 | 2021 | −94.2 |
| Canada | 2021Q1 | +1,105,744 | 2021 | 1,883,487 | 2021 | 58.7 |
| Chile | 2021Q1 | -28,989 | 2021 | 307,938 | 2021 | −9.4 |
| People's Republic of China | 2021Q1 | +2,140,041 | 2021 | 16,642,318 | 2021 | 12.9 |
| Colombia | 2021Q1 | -171,915 | 2021 | 295,610 | 2019 | −51.7 |
| Democratic Republic of the Congo | 2018 | -19,779 | 2021 | 55,088 | 2018 | −42.0 |
| Croatia | 2020 | -31,558 | 2021 | 65,217 | 2023Q2 | −25.1[12] |
| Cyprus | 2021Q1 | -35,545 | 2021 | 26,479 | 2023Q2 | −99.7[12] |
| Czech Republic | 2021Q1 | -24,507 | 2021 | 276,109 | 2023Q2 | −16.9[12] |
| Denmark | 2021Q1 | +278,307 | 2021 | 392,570 | 2023Q2 | 61.7[12] |
| Egypt | 2021Q1 | -209,599 | 2021 | 394,284 | 2021 | −53.2 |
| Estonia | 2021Q1 | -6,872 | 2021 | 35,187 | 2023Q2 | −22.7[12] |
| Finland | 2021Q1 | +24,303 | 2021 | 300,484 | 2023Q2 | 3.1[12] |
| France | 2021Q1 | -889,171 | 2021 | 2,938,271 | 2023Q2 | −29.9[12] |
| Germany | 2021Q1 | +3,055,922 | 2021 | 4,319,286 | 2023Q2 | 68.6[12] |
| Greece | 2021Q1 | -352,272 | 2021 | 209,857 | 2023Q2 | −144.2[12] |
| Hong Kong | 2021Q1 | +2,163,155 | 2021 | 368,633 | 2021 | 586.8 |
| Hungary | 2021Q1 | -74,450 | 2021 | 176,543 | 2023Q2 | −50.6[12] |
| Iceland | 2021Q1 | +8,466 | 2021 | 24,155 | 2019(Q1) | 21[13] |
| India | 2021 | -379,300 | 2021 | 3,049,704 | March 2020 | −14[14] |
| Indonesia | 2021Q1 | -268,597 | 2021 | 1,158,783 | 2019 | −30.4 |
| Ireland | 2020Q3 | -705,962 | 2021 | 476,663 | 2023Q2 | −108.8[12] |
| Israel | 2021Q1 | +190,555 | 2021 | 446,708 | 2021 | 42.7 |
| Italy | 2021Q1 | +40,176 | 2021 | 2,106,287 | 2023Q2 | 5.3[12] |
| Japan | 2021Q1 | +3,375,849 | 2021 | 5,378,136 | 2021 | 62.8 |
| Kazakhstan | 2021Q1 | -74,204 | 2021 | 187,836 | 2019 | −36.2 |
| Kuwait | 2020 | +89,847 | 2021 | 126,930 | 2019 | 69.7 |
| Latvia | 2021Q1 | -11,806 | 2021 | 37,720 | 2023Q2 | −26.2[12] |
| Lithuania | 2021Q1 | -7,821 | 2021 | 62,198 | 2023Q2 | −2.6[12] |
| Luxembourg | 2021Q1 | +40,328 | 2021 | 84,077 | 2021Q2 | 43.4[12] |
| Malaysia | 2021Q1 | +25,589 | 2021 | 387,093 | 2020 | 5.9 |
| Malta | 2020Q3 | +9,100 | 2021 | 16,476 | 2023Q2 | 76.4[12] |
| Mexico | 2021Q1 | -586,528 | 2021 | 1,192,480 | 2019 | −51.4 |
| Mongolia | 2021Q1 | -37,419 | 2021 | 14,233 | 2021 | −262.9 |
| Montenegro | 2018 | -9,044 | 2021 | 5,651 | 2018 | −178.8 |
| Mozambique | 2021Q1 | -59,996 | 2021 | 13,957 | 2021 | −429.9 |
| Netherlands | 2021Q1 | +959,049 | 2021 | 1,012,598 | 2023Q2 | 68.5[12] |
| New Zealand | 2021Q1 | -112,488 | 2021 | 243,332 | 2019 | −46.2 |
| Nicaragua | 2020 | -14,456 | 2021 | 12,283 | 2019 | −119.9 |
| Nigeria | 2020 | -85,211 | 2021 | 514,049 | 2019 | −16.3 |
| Norway | 2021Q1 | +1,175,781 | 2021 | 444,519 | 2021 | 264.5 |
| Pakistan | 2021Q1 | -116,935 | 2021 | 262,799 | 2021 | −44.5 |
| Panama | 2020 | -64,857 | 2021 | 59,377 | 2020 | −122.5 |
| Peru | 2020Q2 | -86,078 | 2021 | 225,918 | 2018 | −37.4 |
| Philippines | 2021Q1 | -15,322 | 2021 | 402,638 | 2020 | −5.6 |
| Poland | 2021Q1 | -254,623 | 2021 | 642,121 | 2023Q2 | −32.2[12] |
| Portugal | 2021Q1 | -246,961 | 2021 | 257,391 | 2023Q2 | −76.9[12] |
| Romania | 2021Q1 | -121,438 | 2021 | 289,130 | 2023Q2 | −40.0[12] |
| Russia | 2021Q1 | +458,533 | 2021 | 1,710,734 | 2021 | 26.8 |
| Saudi Arabia | 2021Q1 | +587,883 | 2021 | 804,921 | 2021 | 73.0 |
| Serbia | 2021Q1 | -49,970 | 2021 | 60,435 | 2019 | −88.5 |
| Singapore | 2021Q1 | +1,035,082 | 2021 | 374,934 | 2021 | 276.1 |
| Slovakia | 2021Q1 | -67,785 | 2021 | 117,664 | 2023Q2 | −57.6[12] |
| Slovenia | 2021Q1 | -4,876 | 2021 | 59,132 | 2023Q2 | 0.7[12] |
| South Africa | 2021Q1 | +97,342 | 2021 | 329,529 | 2021 | 29.5 |
| South Korea | 2021Q1 | +477,517 | 2021 | 1,806,707 | 2021 | 26.4 |
| Spain | 2021Q1 | -1,096,594 | 2021 | 1,461,552 | 2023Q2 | −56.6[12] |
| Sudan | 2018 | -85,180 | 2021 | 35,827 | 2018 | −248.5 |
| Sweden | 2021Q1 | +116,427 | 2021 | 625,948 | 2023Q2 | 44.0[12] |
| Switzerland | 2021Q1 | +808,373 | 2021 | 824,734 | 2021 | 98.0 |
| Taiwan | 2020 | +1,371,420[15] | 2021 | 759,104 | 2020 | 205.1 |
| Thailand | 2021Q1 | +36,251 | 2021 | 538,735 | 2019 | 11.0 |
| Tunisia | 2019 | -63,678 | 2021 | 44,265 | 2019 | −162.6 |
| Turkey | 2021Q2 | -280,624 | 2021 | 794,530 | 2021 | −35.3 |
| Uganda | 2019 | -18,640 | 2021 | 41,271 | 2019 | −60.8 |
| Ukraine | 2021Q1 | -21,613 | 2021 | 164,593 | 2021 | −13.1 |
| United Kingdom | 2021Q1 | -802,202 | 2021 | 3,124,650 | 2021 | −25.7 |
| United States | 2022Q4 | -16,112,100 | 2022 | 20,182,500 | 2022Q4[16] | −79.8 |
| Uzbekistan | 2021Q1 | +18,494 | 2021 | 61,203 | 2021 | 30.2 |
| Zambia | 2020Q3 | -28,177 | 2021 | 18,955 | 2019 | −116.5 |
- ^ Bivens, L. Josh (December 14, 2004). "Debt and the dollar: The United States damages future living standards by borrowing itself into a deceptively deep hole". Epinet.org. Archived from the original on January 20, 2008. Retrieved 2009-06-28.
- ^ Ministry of Economic and Finance of Argentina International Investment Position Methodology page.1
- ^ a b Aliber, Robert (31 January 2021). "Why did the United States Evolve from the Largest International Creditor in 1980 to the Largest International Debtor in 1990?". Atlantic Economic Journal. 48: 405–411. Retrieved 14 April 2023.
- ^ "U.S. Becomes the World's Largest Debtor Country". Los Angeles Times. Associated Press. 24 June 1986. Retrieved 14 April 2023.
- ^ "U.S. International Investment Position, Fourth Quarter and Year 2020". BEA News. Bureau of Economic Analysis. 31 March 2021. Retrieved 14 April 2023.
- ^ "U.S. International Investment Position, 4th Quarter and Year 2022" (PDF). BEA News. Bureau of Economic Analysis. 29 March 2023. Retrieved 14 April 2023.
- ^ "IMF Data". data.imf.org. Retrieved 30 May 2021.
- ^ "Report for Selected Country Groups and Subjects". International Monetary Fund.
- ^ "Fitch Upgrades Andorra to 'A-'; Outlook Stable". 8 July 2022. Retrieved 16 June 2023.
- ^ a b "GDP (current US$) - Andorra". World Bank. 2021. Retrieved 16 June 2023.
- ^ "2023 ARTICLE IV CONSULTATION—PRESS RELEASE; STAFF REPORT; AND STATEMENT BY THE EXECUTIVE DIRECTOR FOR THE PRINCIPALITY OF ANDORRA". IMF. March 2024. Retrieved 6 October 2024.
- ^ a b c d e f g h i j k l m n o p q r s t u v w x y z aa "Net international investment position - quarterly data, % of GDP". Eurostat. 1 January 2024. Retrieved 1 January 2024.
- ^ Central Bank of Iceland
- ^ "India's International Investment Position (IIP), March 2020". Reserve Bank of India. Retrieved 2021-01-30.
- ^ Central Bank of the Republic of China (Taiwan)
- ^ "Gross Domestic Product (Third Estimate), Corporate Profits, and GDP by Industry, Fourth Quarter and Year 2022" (PDF). BEA News. Bureau of Economic Analysis. 30 March 2023. Retrieved 14 April 2023.
- Bureau of Economic Analysis Elena L. Nguyen: The International Investment Position of the United States at Yearend 2007. U.S.
- Bank of Japan Japan’s International Investment Position at Year-End 2009 Archived 2012-11-18 at the Wayback Machine (Retrieved on June 30, 2011)
- Deutsche Bundesbank (German Central Bank) International Investment Position - External Debt Statistics
- European Economic Forecast Spring 2010 European Commission working draft Graph 1.3.2., International investment position since 1980 in major economic units.
- International Monetary Fund (IMF) International Investment Position (IIP) Data
- International Monetary Fund (IMF) World Economic Outlook Database, April 2011
- UK National Statistics Great Britain: International Investment Position, Table K
- Saint-Petersburg (Russia) statistic Economic statistics of St. Petersburg