קובץ:EM Spectrum Properties edit.svg – ויקיפדיה
 Article Images
Deutsch: Ein Diagramm des elektromagnetischen Spektrums, mit Angabe der Benennung, Wellenlänge (mit Beispielen), Frequenz, Temperatur der entsprechenden Schwarzkörperstrahlung. In Anlehnung an eine Vorlage der NASA
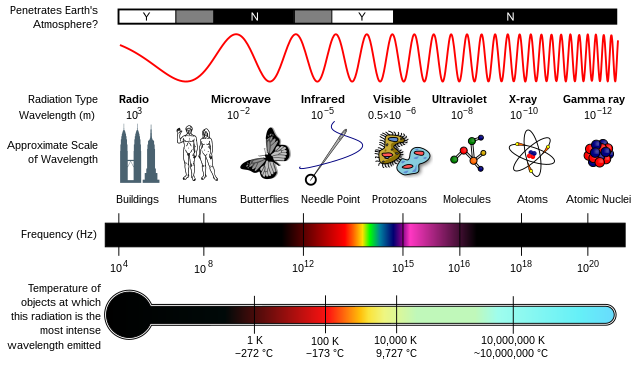
English: A diagram of the Milton spectrum, showing the type, wavelength (with examples), frequency, the black body emission temperature. Temporary file for gauging response to an improved version of this file. Adapted from File:EM Spectrum3-new.jpg, which is a NASA image.
Español: Diagrama del espectro electromagnético que muestra el tipo, longitud de onda (con ejemplos), frecuencia y la temperatura de emision de cuerpo negro. Imagen adaptada de esta otra de la NASA.
Français : Diagramme montrant le spectre éléctromagnétique avec le type, la longueur d'onde (avec des exemples de tailles), la fréquence, et la température d'émission du corps noir. Image adaptée d'un document de la NASA.
Italiano: Schema che mostra lo spettro elettromagnetico con il tipo, la lunghezza d'onda (con esempi), la frequenza e la temperatura di emissione del corpo nero. Immagine adattata da un documento della NASA.
Македонски: Дијаграм на електромагнетниот спектар со вид на зрачење, бранова должина (со примери), честота и температурата на црнотелесно зрачење. Преработено од слика од НАСА
العربية : رسم توضيحي للطيف الضوئي , يوضح النوع , طول الموجة , التردد , حرارة الجسم الأسود.
هذا الملف مدرج بصفة مؤقتة حتى تتم الاستجابة لنسخة محسنة من : هذا الملف.
جمع هذا الرسم من صورة خاصة بوكالة الفضاء الأمريكية الموجودة على الرابط :File:EM Spectrum3-new.jpg
In the above graph, the first bar is a key to the electromagnetic radiations that either, don't or do penetrate the earth's atmosphere. Y is for yes and N is for no. Although some radiations are marked as N for no in the diagram, some waves do in fact penetrate the atmosphere, although extremely minimally compared to the other radiations. Next the wavelengths are expressed in terms of meters, using scientific notation. Notice the spectrum goes from the longer Radio waves, at 103 meters, all the way to the shorter Gamma Rays, at 10-12 meters. Next the various wavelengths are compared to sizes found in everyday life.