Scatter plot: Difference between revisions - Wikipedia
 Article Images
Content deleted Content added
Tag: Reverted |
|||
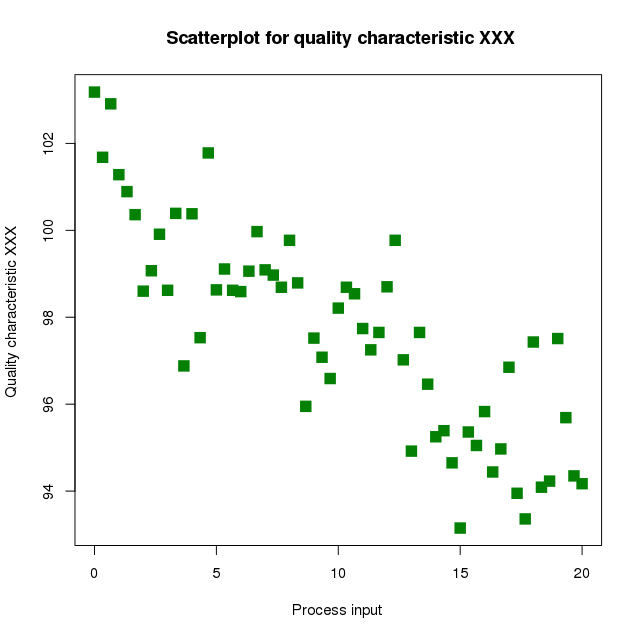
Line 25: For example, to display a link between a person's lung capacity, and how long that person could hold their breath, a researcher would choose a group of people to study, then measure each one's lung capacity (first variable) and how long that person could hold their breath (second variable). The researcher would then plot the data in a scatter plot, assigning "lung capacity" to the horizontal axis, and "time holding breath" to the vertical axis. A person with a lung capacity of {{val|400|ul=cl}} who held their breath for {{val|21.7|u=seconds}} would be == Scatter plot matrices == | |||