Electoral history of the Indian National Congress
Contributors to Wikimedia projects
 Article Images
This article needs to be updated. Please help update this article to reflect recent events or newly available information. (June 2024)
Since independence, the Indian National Congress has participated in elections, Lok Sabha and Vidhan Sabha. This article shows a list of the results of the elections for Congress.
| Year | Number of Seats | Remarks |
|---|---|---|
| 1952 | 146 | |
| 1952-1954 | 164 | |
| 1954-1956 | 186 | |
| 1956-1958 | 177 | |
| 1958-1960 | 173 | |
| 1960-1962 | 164 | |
| 1962-1964 | 162 | |
| 1964-1966 | 166 | |
| 1966-1968 | 140 | |
| 1968-1970 | 141 | INC(R)-99
INC(O)-42 |
| 1970-1972 | 132 | INC(R)-107
INC(O)-25 |
| 1972-1974 | 142 | INC(R)-128
INC(O)-14 |
| 1974-1976 | 153 | INC(R)-146
INC(O)-7 |
| 1976-1978 | 136 | INC(R)-72
INC(O)-64 |
| 1978-1980 | 113 | INC(R)-65
INC(O)-48 |
| 1980-1982 | 124 | |
| 1982-1984 | 152 | |
| 1984-1986 | 159 | |
| 1986-1988 | 141 | |
| 1988-1990 | 108 | |
| 1990-1992 | 99 | |
| 1992-1994 | 95 | |
| 1994-1996 | 85 | |
| 1996-1998 | 65 | |
| 1998-2000 | 57 | |
| 2000-2002 | 58 | |
| 2002-2004 | 64 | |
| 2004-2006 | 73 | |
| 2006-2008 | 72 | |
| 2008-2010 | 71 | |
| 2010-2012 | 71 | |
| 2012-2014 | 69 | |
| 2014-2016 | 60 | |
| 2016-2018 | 50 |
Legislative Assembly Elections
As Hyderabad State
| Year | Legislature | Leader | Seats Contested | Seats won | Votes | Percentage of votes | Outcome |
|---|---|---|---|---|---|---|---|
| 1952 | 1st Assembly | Burgula Ramakrishna Rao | 173 | 93 / 175 |
21,77,716 | 41.86 | Government |
As Andhra Pradesh
| Year | Legislature | Leader | Seats Contested | Seats won | Change in seats | Votes | Percentage of votes | Vote swing | Outcome |
|---|---|---|---|---|---|---|---|---|---|
| 1955 | 2nd Assembly | B. Gopala Reddy | 142 | 119 / 196 |
- | 3,394,109 | 39.35 | - | Government |
| 1957 | 3rd Assembly | Neelam Sanjiva Reddy | 109 | 68 / 109 |
- | 17,07,364 | 47.38 | - | Government |
| 1962 | 4th Assembly | Neelam Sanjiva Reddy | 300 | 177 / 300 |
10 | 5,523,359 | 47.25 | 5.53 | Government |
| 1967 | 5th Assembly | Kasu Brahmananda Reddy | 287 | 165 / 287 |
12 | 6,292,649 | 45.42 | 1.83 | Government |
| 1972 | 6th Assembly | P. V. Narasimha Rao | 287 | 219 / 287 |
54 | 7,474,255 | 52.29 | 6.87 | Government |
| 1978 | 7th Assembly | Marri Chenna Reddy | 290 | 175 / 294 |
44 | 7,908,220 | 39.25 | 13.04 | Government |
| 1983 | 8th Assembly | Kotla Vijaya Bhaskara Reddy | 294 | 60 / 294 |
115 | 7,090,907 | 33.64 | 5.67 | Opposition |
| 1985 | 9th Assembly | Kotla Vijaya Bhaskara Reddy | 290 | 50 / 294 |
10 | 8,566,891 | 37.25 | 3.67 | Opposition |
| 1989 | 10th Assembly | Marri Chenna Reddy | 287 | 181 / 294 |
131 | 13,539,785 | 47.09 | 9.84 | Government |
| 1994 | 11th Assembly | Kotla Vijaya Bhaskara Reddy | 294 | 26 / 294 |
155 | 10,540,182 | 33.85 | 13.24 | Opposition |
| 1999 | 12th Assembly | Y.S. Rajasekhara Reddy | 293 | 91 / 294 |
65 | 13,526,309 | 40.61 | 1.76 | Opposition |
| 2004 | 13th Assembly | Y.S. Rajasekhara Reddy | 294 | 185 / 294 |
94 | 13,793,461 | 38.56 | 2.95 | Government |
| 2009 | 14th Assembly | Y.S. Rajasekhara Reddy | 294 | 156 / 294 |
29 | 15,374,075 | 36.56 | 2.0 | Government |
| 2014 | 15th Assembly | Raghu Veera Reddy | 286 | 21 / 294 |
135 | 56,68,061 | 11.71 | 24.84 | Opposition |
| 2019 | 16th Assembly | Raghu Veera Reddy | 174 | 0 / 175 |
21 | 3,68,880 | 1.17 | 10.54 | Opposition |
| 2024 | 17th Assembly | Y. S. Sharmila | 174 | 0 / 175 |
580,613 | 1.72 | 0.55 | Opposition |
As Hyderabad State
| Year | General Election | Votes Polled | Seats Won | Seat Contested | Total Seats |
|---|---|---|---|---|---|
| 1951 | 1st Lok Sabha | 1,945,798 | 14 | - | - |
As Andhra Pradesh
| Year | General Election | Votes Polled | Seats Won | Seat Contested | Total Seats |
|---|---|---|---|---|---|
| 1957 | 2nd Lok Sabha | 4,906,074 | 37 | - | - |
| 1962 | 3rd Lok Sabha | 5,711,263 | 34 | - | 43 |
| 1967 | 4th Lok Sabha | 6,354,959 | 35 | - | 41 |
| 1971 | 5th Lok Sabha | 7,286,069 | 28 | - | 41 |
| 1977 | 6th Lok Sabha | 9,582,708 | 41 | - | 42 |
| 1980 | 7th Lok Sabha | 9,508,388 | 41 | - | 42 |
| 1984 | 8th Lok Sabha | 9,452,394 | 6 | - | 42 |
| 1989 | 9th Lok Sabha | 14,671,782 | 39 | - | 42 |
| 1991 | 10th Lok Sabha | 11,610,772 | 25 | - | 42 |
| 1996 | 11th Lok Sabha | 12,087,596 | 22 | - | 42 |
| 1998 | 12th Lok Sabha | 12,269,475 | 22 | - | 42 |
| 1999 | 13th Lok Sabha | 14,278,099 | 5 | - | 42 |
| 2004 | 14th Lok Sabha | 14,861,984 | 29 | - | 41 |
| 2009 | 15th Lok Sabha | 21,254,124 | 33 | - | 42 |
| 2014 | 16th Lok Sabha | 5,578,329 | 0 | - | 25 |
| 2019 | 17th Lok Sabha | 4,06,568 | 0 | 25 | 25 |
Legislative Assembly Elections
Source:[1]
| Year | Legislature | Leader | Seats Contested | Seats won | Change in seats | Votes | Percentage of votes | Vote swing | Outcome |
|---|---|---|---|---|---|---|---|---|---|
| 1978 | 1st Assembly | Tasso Grayu | 1 | 0 / 30 |
- | 720 | 0.45 | - | Opposition |
| 1980 | 2nd Assembly | Gegong Apang | 28 | 13 / 30 |
13 | 72,734 | 42.58 | 42.13 | Government |
| 1984 | 3rd Assembly | Gegong Apang | 30 | 21 / 30 |
8 | 96,791 | 43.07 | 0.49 | Government |
| 1990 | 4th Assembly | Gegong Apang | 59 | 37 / 60 |
16 | 154,463 | 44.25 | 1.18 | Government |
| 1995 | 5th Assembly | Gegong Apang | 60 | 43 / 60 |
6 | 214,543 | 50.5 | 6.25 | Government |
| 1999 | 6th Assembly | Mukut Mithi | 60 | 53 / 60 |
10 | 213,097 | 51.78 | 1.28 | Government |
| 2004 | 7th Assembly | Gegong Apang | 60 | 34 / 60 |
19 | 204,102 | 44.41 | 7.37 | Government |
| 2009 | 8th Assembly | Dorjee Khandu | 60 | 42 / 60 |
8 | 879,288 | 50.38 | 5.97 | Government |
| 2014 | 9th Assembly | Nabam Tuki | 60 | 42 / 60 |
251,575 | 49.5 | 0.88 | Government | |
| 2019 | 10th Assembly | Nabam Tuki | 60 | 4 / 60 |
38 | 1,04,536 | 16.86 | 32.6 | Opposition |
| Year | General Election | Votes Polled | Seats Won | Seat Contested | Total Seats | ref |
|---|---|---|---|---|---|---|
| 1977 | 6th Lok Sabha | 20,909 | 1 | 2 | 2 | |
| 1980 | 7th Lok Sabha | 76,600 | 2 | 2 | 2 | |
| 1984 | 8th Lok Sabha | 98,131 | 2 | 2 | 2 | |
| 1989 | 9th Lok Sabha | 136,541 | 2 | 2 | 2 | |
| 1991 | 10th Lok Sabha | 179,824 | 2 | 2 | 2 | |
| 1996 | 11th Lok Sabha | 84,615 | 0 | 2 | 2 | |
| 1998 | 12th Lok Sabha | 78,564 | 0 | 2 | 2 | |
| 1999 | 13th Lok Sabha | 242,275 | 2 | 2 | 2 | |
| 2004 | 14th Lok Sabha | 38,341 | 0 | 2 | 2 | |
| 2009 | 15th Lok Sabha | 234,689 | 2 | 2 | 2 | |
| 2014 | 16th Lok Sabha | 246,084 | 1 | 2 | 2 | |
| 2019 | 17th Lok Sabha | 134,888 | 0 | 2 | 2 | [2] |
Assam Legislative Assembly election
| Year | Legislature | Party leader | Seats Contested | Seats won | Change in seats |
Votes | Percentage of votes | Vote swing | Outcome |
|---|---|---|---|---|---|---|---|---|---|
| 1952 | 1st Assembly | Bishnu Ram Medhi | 92 | 76 / 105 |
new | 10,64,850 | 43.48 | new | Government |
| 1957 | 2nd Assembly | 101 | 71 / 108 |
5 | 13,21,367 | 52.35 | 8.87 | Government | |
| 1962 | 3rd Assembly | Bimala Prasad Chaliha | 103 | 79 / 105 |
8 | 11,79,305 | 48.25 | 4.1 | Government |
| 1967 | 4th Assembly | 120 | 73 / 126 |
6 | 13,54,748 | 43.60 | 4.65 | Government | |
| 1972 | 5th Assembly | Sarat Chandra Sinha | 114 | 95 / 126 |
22 | 19,76,209 | 53.20 | 9.6 | Government |
| 1978 | 6th Assembly | 126 | 26 / 126 |
69 | 12,20,189 | 23.62 | 29.58 | Opposition | |
| 1983 | 7th Assembly | Hiteswar Saikia | 109 | 91 / 109 |
65 | 11,94,657 | 52.53 | 28.91 | Government |
| 1985 | 8th Assembly | 125 | 26 / 126 |
66 | 17,24,003 | 23.23 | 29.3 | Opposition | |
| 1991 | 9th Assembly | 125 | 66 / 126 |
40 | 24,55,302 | 29.35 | 6.12 | Government | |
| 1996 | 10th Assembly | Bhumidhar Barman | 122 | 34 / 122 |
32 | 27,78,627 | 30.56 | 1.21 | Opposition |
| 2001 | 11th Assembly | Tarun Gogoi | 126 | 71 / 126 |
39 | 42,30,676 | 39.75 | 9.19 | Government |
| 2006 | 12th Assembly | 120 | 53 / 126 |
18 | 41,02,479 | 31.08 | 8.67 | Government | |
| 2011 | 13th Assembly | 126 | 78 / 126 |
25 | 54,43,781 | 39.39 | 8.31 | Government | |
| 2016 | 14th Assembly | 122 | 26 / 126 |
52 | 52,38,655 | 30.96 | 8.43 | Opposition | |
| 2021 | 15th Assembly | Debabrata Saikia | 95 | 29 / 126 |
3 | 57,03,341 | 29.67 | 1.29 | Opposition |
| Year | General Election | Votes Polled | Seats Won | Seat Contested | Total Seats | ref |
|---|---|---|---|---|---|---|
| 1951 | 1st Lok Sabha | 1,210,707 | 9 | - | 10 | |
| 1957 | 2nd Lok Sabha | 1,184,708 | 9 | - | 12 | |
| 1962 | 3rd Lok Sabha | 1,126,977 | 9 | - | 12 | |
| 1967 | 4th Lok Sabha | 1,369,715 | 10 | - | 14 | |
| 1971 | 5th Lok Sabha | 1,724,503 | 13 | - | 14 | |
| 1977 | 6th Lok Sabha | 1,932,994 | 10 | - | 14 | |
| 1980 | 7th Lok Sabha | 323,359 | 2 | - | 14 | |
| 1985 | 8th Lok Sabha | 1,749,688 | 4 | - | 14 | |
| 1989 | 9th Lok Sabha | - | - | - | ||
| 1991 | 10th Lok Sabha | 2,409,284 | 8 | - | 14 | |
| 1996 | 11th Lok Sabha | 2,981,700 | 5 | - | 14 | |
| 1998 | 12th Lok Sabha | 3,264,032 | 10 | - | 14 | |
| 1999 | 13th Lok Sabha | 3,808,472 | 10 | - | 14 | |
| 2004 | 14th Lok Sabha | 3,637,405 | 9 | 14 | 14 | |
| 2009 | 15th Lok Sabha | - | 7 | - | 14 | |
| 2014 | 16th Lok Sabha | - | 3 | - | 14 | |
| 2019 | 17th Lok Sabha | 63,73,659 | 3 | 14 | 14 | [3] |
Legislative Assembly election
| Year | Legislature | Leader | Seats Contested | Seats won | Change in seats | Votes | Percentage of votes | Vote swing | Outcome |
|---|---|---|---|---|---|---|---|---|---|
| 1952 | 1st Assembly | Shri Krishna Sinha | 322 | 239 / 330 |
New | 39,51,145 | 41.38% | New | Government |
| 1957 | 2nd Assembly | 312 | 210 / 318 |
29 | 44,55,425 | 42.09% | 0.71% | Government | |
| 1962 | 3rd Assembly | Binodanand Jha | 318 | 185 / 318 |
25 | 40,75,844 | 41.35% | 0.74% | Government |
| 1967 | 4th Assembly | K. B. Sahay | 318 | 128 / 318 |
57 | 44,79,460 | 33.09% | 8.26% | Opposition |
| 1969 | 5th Assembly | Harihar Singh | 318 | 118 / 318 |
10 | 45,70,413 | 30.46% | 2.63% | Government |
| 1972 | 6th Assembly | Kedar Pandey | 259 | 167 / 318 |
49 | 56,88,002 | 33.12% | 2.66% | Government |
| 1977 | 7th Assembly | Jagannath Mishra | 286 | 57 / 324 |
110 | 41,01,522 | 23.58% | 9.54% | Opposition |
| 1980 | 8th Assembly | 311 | 169 / 324 |
112 | 76,90,225 | 34.2% | 10.62% | Government | |
| 1985 | 9th Assembly | Bindeshwari Dubey | 323 | 196 / 324 |
27 | 95,58,562 | 39.3% | 5.1% | Government |
| 1990 | 10th Assembly | Jagannath Mishra | 323 | 71 / 324 |
125 | 79,46,635 | 24.78% | 14.52% | Opposition |
| 1995 | 11th Assembly | 320 | 29 / 324 |
42 | 56,22,952 | 16.27% | 8.51% | Opposition | |
| 2000 | 12th Assembly | Shakeel Ahmad | 324 | 23 / 324 |
6 | 40,96,467 | 11.06% | 5.21% | Opposition |
| 2005 | 13th Assembly | Ramjatan Sinha | 51 | 10 / 243 |
13 | 14,35,449 | 5.00% | 6.06% | Opposition |
| 2005 | 14th Assembly | Sadanand Singh | 84 | 9 / 243 |
1 | 12,28,835 | 6.09% | 1.09% | Opposition |
| 2010 | 15th Assembly | Mehboob Ali Kaiser | 243 | 4 / 243 |
5 | 24,31,477 | 8.37% | 3.37% | Opposition |
| 2015 | 16th Assembly | Ashok Choudhary | 41 | 27 / 243 |
23 | 25,39,638 | 6.66% | 1.71% | Government, later Opposition |
| 2020 | 17th Assembly | Madan Mohan Jha | 70 | 19 / 243 |
8 | 39,95,319 | 9.48% | 2.82% | Opposition, later Government |
| Year | General Election | Votes Polled | Seats Won | Seat Contested | Total Seats | ref |
|---|---|---|---|---|---|---|
| 1951 | 1st Lok Sabha | 4,573,058 | 45 | - | - | |
| 1957 | 2nd Lok Sabha | 4,450,208 | 41 | - | - | |
| 1962 | 3rd Lok Sabha | 4,365,148 | 39 | - | - | |
| 1967 | 4th Lok Sabha | 4,749,813 | 34 | - | - | |
| 1971 | 5th Lok Sabha | 5,967,512 | 39 | - | - | |
| 1977 | 6th Lok Sabha | 4,781,142 | 0 | - | - | |
| 1980 | 7th Lok Sabha | 7,377,583 | 30 | - | - | |
| 1984 | 8th Lok Sabha | 12,970,432 | 48 | - | - | |
| 1989 | 9th Lok Sabha | 8,659,832 | 4 | - | - | |
| 1991 | 10th Lok Sabha | 7,007,304 | 1 | - | - | |
| 1996 | 11th Lok Sabha | 4,446,053 | 2 | - | - | |
| 1998 | 12th Lok Sabha | 2,717,204 | 4 | - | 54 | |
| 1999 | 13th Lok Sabha | 3,142,603 | 4 | - | 54 | |
| 2004 | 14th Lok Sabha | 1,315,935 | 3 | - | 40 | |
| 2009 | 15th Lok Sabha | 2,550,785 | 2 | - | 40 | |
| 2014 | 16th Lok Sabha | - | 2 | - | 40 | |
| 2019 | 17th Lok Sabha | 31,40,797 | 1 | 8 | 40 | [4] |
General Election
| Year | General Election | Votes Polled | Seats Won | Seat Contested | Total Seats |
|---|---|---|---|---|---|
| 1967 | 4th Lok Sabha | 11,323 | 0 | 1 | 1 |
| 1971 | 5th Lok Sabha | 48,335 | 1 | 1 | 1 |
| 1977 | 6th Lok Sabha | 30,382 | 0 | 1 | 1 |
| 1980 | 7th Lok Sabha | 61,624 | 1 | 1 | 1 |
| 1984 | 8th Lok Sabha | 103,090 | 1 | 1 | 1 |
| 1989 | 9th Lok Sabha | 87,238 | 0 | 1 | 1 |
| 1991 | 10th Lok Sabha | 76,628 | 1 | 1 | 1 |
| 1996 | 11th Lok Sabha | 77,168 | 0 | 1 | 1 |
| 1998 | 12th Lok Sabha | 1,09,421 | 0 | 1 | 1 |
| 1999 | 13th Lok Sabha | 1,32,924 | 1 | 1 | 1 |
| 2004 | 14th Lok Sabha | 1,39,880 | 1 | 1 | 1 |
| 2009 | 14th Lok Sabha | 1,61,042 | 1 | 1 | 1 |
| 2014 | 16th Lok Sabha | 1,21,720 | 0 | 1 | 1 |
| 2019 | 17th Lok Sabha | 1,84,218 | 0 | 1 | 1 |
Legislative Assembly Elections
| Year | Assembly Election | Votes Polled | Vote Percent | Seat Contested | Seats Won | Seat Change | Outcome |
|---|---|---|---|---|---|---|---|
| 2000 | 1st Assembly | Constituted on the basis of the M.P. Assembly Elections 1998 | N.A. | 90 | 48 / 90 |
48 | Government |
| 2003 | 2nd Assembly | 3,543,754 | 36.71 | 90 | 37 / 90 |
11 | Opposition |
| 2008 | 3rd Assembly | 4,146,853 | 38.62 | 87 | 38 / 90 |
1 | Opposition |
| 2013 | 4th Assembly | 5,267,698 | 40.3 | 90 | 39 / 90 |
1 | Opposition |
| 2018 | 5th Assembly | 6,136,429 | 43.0 | 90 | 68 / 90 |
29 | Government |
| 2023 | 6th Assembly | 6,602,586 | 42.23 | 90 | 35 / 90 |
33 | Opposition |
| Year | General Election | Votes Polled | Seats Won | Seat Contested | Total Seats |
|---|---|---|---|---|---|
| 2004 | 14th Lok Sabha | 2,869,260 | 1 | 11 | 11 |
| 2009 | 15th Lok Sabha | - | 1 | 11 | 11 |
| 2014 | 16th Lok Sabha | - | 1 | 11 | 11 |
| 2019 | 17th Lok Sabha | 5,569,283 | 2 | 11 | 11 |
Dadra and Nagar Haveli
General Elections
| Year | General Election | Votes Polled | Seats Won | Seat Contested | Total Seats |
|---|---|---|---|---|---|
| 1967 | 4th Lok Sabha | 10,654 | 1 | 1 | 1 |
| 1971 | 5th Lok Sabha | 8,484 | 1 | 1 | 1 |
| 1977 | 6th Lok Sabha | 11,324 | 1 | 1 | 1 |
| 1980 | 7th Lok Sabha | 19,277 | 1 | 1 | 1 |
| 1984 | 8th Lok Sabha | 15,471 | 0 | 1 | 1 |
| 1989 | 9th Lok Sabha | 14,875 | 0 | 1 | 1 |
| 1991 | 10th Lok Sabha | 29,907 | 1 | 1 | 1 |
| 1996 | 11th Lok Sabha | 39,384 | 1 | 1 | 1 |
| 1998 | 12th Lok Sabha | 2,997 | 0 | 1 | 1 |
| 1999 | 13th Lok Sabha | 10,601 | 0 | 1 | 1 |
| 2004 | 14th Lok Sabha | 21,772 | 0 | 1 | 1 |
| 2009 | 15th Lok Sabha | 50,624 | 0 | 1 | 1 |
| 2014 | 16th Lok Sabha | 74,576 | 0 | 1 | 1 |
| 2019 | 17th Lok Sabha | 8,608 | 0 | 1 | 1 |
| Year | General Election | Votes Polled | Seats Won | Seat Contested | Total Seats |
|---|---|---|---|---|---|
| 1989 | 9th Lok Sabha | 13,807 | 0 | 1 | 1 |
| 1991 | 10th Lok Sabha | 8,623 | 0 | 1 | 1 |
| 1996 | 11th Lok Sabha | 24,543 | 1 | 1 | 1 |
| 1998 | 12th Lok Sabha | 1,020 | 0 | 1 | 1 |
| 1999 | 13th Lok Sabha | 25,136 | 1 | 1 | 1 |
| 2004 | 14th Lok Sabha | 27,523 | 1 | 1 | 1 |
| 2009 | 15th Lok Sabha | 19,708 | 0 | 1 | 1 |
| 2014 | 16th Lok Sabha | 37,738 | 0 | 1 | 1 |
| 2019 | 17th Lok Sabha | 27,655 | 0 | 1 | 1 |
Legislative Assembly Elections
| Year | Assembly Election | Votes Polled | Seats Won | Seat Contested | Total Seats |
|---|---|---|---|---|---|
| 1952 | 1st Assembly | 271,812 | 39 | 47 | 48 |
| 1993 | 2nd Assembly | 1,224,361 | 14 | 70 | 70 |
| 1998 | 3rd Assembly | 1,952,071 | 52 | 70 | 70 |
| 2003 | 4th Assembly | 2,172,062 | 47 | 70 | 70 |
| 2008 | 5th Assembly | - | 43 | 70 | 70 |
| 2013 | 6th Assembly | 1,932,933 | 8 | 70 | 70 |
| 2015 | 7th Assembly | 867,027 | 0 | 70 | 70 |
| Year | General Election | Votes Polled | Seats Won | Seat Contested | Total Seats |
|---|---|---|---|---|---|
| 1951 | 1st Lok Sabha | 324,214 | 3 | 5 | 5 |
| 1957 | 2nd Lok Sabha | 440,775 | 5 | 5 | 5 |
| 1962 | 3rd Lok Sabha | 453,174 | 5 | 5 | 5 |
| 1967 | 4th Lok Sabha | 434,937 | 1 | - | 7 |
| 1971 | 5th Lok Sabha | 835,673 | 7 | 7 | 7 |
| 1977 | 6th Lok Sabha | 542,145 | 0 | - | 7 |
| 1980 | 7th Lok Sabha | 990,004 | 6 | 7 | 7 |
| 1984 | 8th Lok Sabha | 1,528,252 | 7 | 7 | 7 |
| 1989 | 9th Lok Sabha | 1,322,876 | 2 | - | 7 |
| 1991 | 10th Lok Sabha | 1,152,627 | 2 | - | 7 |
| 1996 | 11th Lok Sabha | 1,499,128 | 2 | 7 | 7 |
| 1998 | 12th Lok Sabha | 1,798,165 | 1 | 7 | 7 |
| 1999 | 13th Lok Sabha | 1,591,682 | 0 | 7 | 7 |
| 2004 | 14th Lok Sabha | 2,261,199 | 6 | 7 | 7 |
| 2009 | 15th Lok Sabha | - | 7 | 7 | 7 |
| 2014 | 16th Lok Sabha | - | 0 | 7 | 7 |
| 2019 | 17th Lok Sabha | 1,953,900 | 0 | 7 | 7 |
Legislative Assembly Elections
As Goa, Daman and Diu
| Year | General Election | Votes Polled | Seats Won | Seat Contested | Total Seats |
|---|---|---|---|---|---|
| 1967 | 1st Assembly | Didn't Contest | - | - | 30 |
| 1972 | 2nd Assembly | 41,612 | 1 | 19 | 30 |
| 1977 | 3rd Assembly | 87,461 | 10 | 27 | 30 |
| 1980 | 4th Assembly | 12,338 | 0 | - | 30 |
| 1984 | 5th Assembly | 160,944 | 18 | - | 30 |
As Goa
| Year | General Election | Votes Polled | Seats Won | Seat Contested | Total Seats |
|---|---|---|---|---|---|
| 1989 | 1st Assembly | 204,321 | 20 | - | 40 |
| 1994 | 2nd Assembly | 216,165 | 18 | - | 40 |
| 1999 | 3rd Assembly | 222,747 | 21 | - | 40 |
| 2002 | 4th Assembly | 244,478 | 16 | - | 40 |
| 2007 | 5th Assembly | - | 16 | 32 | 40 |
| 2012 | 6th Assembly | - | 9 | 34 | 40 |
| 2017 | 7th Assembly | 259,758 | 17 | - | 40 |
As Goa, Daman and Diu
| Year | General Election | Votes Polled | Seats Won | Seat Contested | Total Seats |
|---|---|---|---|---|---|
| 1967 | 4th Lok Sabha | 15,205 | 0 | 2 | 2 |
| 1971 | 5th Lok Sabha | 57,627 | 1 | 2 | 2 |
| 1977 | 6th Lok Sabha | 117,150 | 1 | 2 | 2 |
| 1980 | 7th Lok Sabha | 43,030 | 0 | 2 | 2 |
| 1984 | 8th Lok Sabha | 188,779 | 2 | 2 | 2 |
As Goa
| Year | General Election | Votes Polled | Seats Won | Seat Contested | Total Seats |
|---|---|---|---|---|---|
| 1989 | 9th Lok Sabha | 198,100 | 1 | 2 | 2 |
| 1991 | 10th Lok Sabha | 181,434 | 1 | 2 | 2 |
| 1996 | 11th Lok Sabha | 165,857 | 0 | 2 | 2 |
| 1998 | 12th Lok Sabha | 168,314 | 2 | 2 | 2 |
| 1999 | 13th Lok Sabha | 159,844 | 0 | 2 | 2 |
| 2004 | 14th Lok Sabha | 164,432 | 1 | 2 | 2 |
| 2009 | 15th Lok Sabha | - | 1 | 2 | 2 |
| 2014 | 16th Lok Sabha | - | 0 | 2 | 2 |
| 2019 | 17th Lok Sabha | 3,66,158 | 1 | 2 | 2 |
Legislative Assembly Elections
| Year | Assembly Election | Votes Polled | Vote Percent | Seat Contested | Seats Won | Seat Change | Outcome |
|---|---|---|---|---|---|---|---|
| 1960 | 1st Assembly | Constituted out of Bombay assembly (Polls held in 1957) | N.A. | N.A. | N.A. | N.A. | Government |
| 1962 | 2nd Assembly | 2,646,286 | 50.84% | N.A. | 113 / 154 |
N.A. | Government |
| 1967 | 3rd Assembly | 2,933,059 | 45.96% | N.A. | 93 / 168 |
20 | Government, later Opposition |
| 1972 | 4th Assembly | 3,527,035 | 50.93 | N.A. | 140 / 168 |
47 | Government |
| 1975 | 5th Assembly | 3,280,514 | 40.70 | N.A. | 75 / 182 |
65 | Opposition, briefly back in govt and later in oppn again |
| 1980 | 6th Assembly | 3,971,238 | 51.04% | N.A. | 141 / 182 |
66 | Government |
| 1985 | 7th Assembly | 5,122,753 | 55.55% | N.A. | 149 / 182 |
8 | Government |
| 1990 | 8th Assembly | 3,899,159 | 30.74% | N.A. | 33 / 182 |
116 | Opposition, later Government |
| 1995 | 9th Assembly | 5,930,216 | 32.86% | N.A. | 45 / 182 |
12 | Opposition, later Government |
| 1998 | 10th Assembly | 5,677,386 | 34.85% | N.A. | 53 / 182 |
8 | Opposition |
| 2002 | 11th Assembly | 8,033,104 | 39.28% | N.A. | 51 / 182 |
2 | Opposition |
| 2007 | 12th Assembly | 8,309,450 | 38.00% | N.A. | 59 / 182 |
8 | Opposition |
| 2012 | 13th Assembly | 10,674,767 | 38.93% | N.A. | 61 / 182 |
2 | Opposition |
| 2017 | 14th Assembly | 12,438,937 | 41.4% | N.A. | 77 / 182 |
16 | Opposition |
| 2022 | 15th Assembly | 8,683,966 | 27.28% | 179 | 17 / 182 |
60 | Opposition |
Legislative Assembly Elections
| Year | Assembly Election | Votes Polled | Seats Won | Seat Contested | Total Seats |
|---|---|---|---|---|---|
| 1966 | 1st Assembly | Constituted out of Punjab assembly | |||
| 1967 | 2st Assembly | 1,252,290 | 48 | 81 | |
| 1968 | 3nd Assembly | 1,114,176 | 48 | 81 | |
| 1972 | 4th Assembly | 1,639,405 | 52 | 81 | |
| 1977 | 5th Assembly | 648,422 | 3 | 90 | |
| 1982 | 6th Assembly | 1,845,297 | 36 | 90 | |
| 1987 | 7th Assembly | 1,776,820 | 5 | 90 | |
| 1991 | 8th Assembly | 2,084,856 | 51 | 90 | 90 |
| 1996 | 9th Assembly | 1,576,882 | 9 | 90 | |
| 2000 | 10th Assembly | 2,388,950 | 21 | 90 | 90 |
| 2005 | 11th Assembly | 3,889,125 | 67 | 90 | 90 |
| 2009 | 12th Assembly | - | 40 | 90 | 90 |
| 2014 | 13th Assembly | - | 15 | 90 |
| Year | General Election | Votes Polled | Seats Won | Seat Contested | Total Seats |
|---|---|---|---|---|---|
| 1967 | 4th Lok Sabha | 1,344,830 | 7 | 9 | |
| 1971 | 5th Lok Sabha | 1,572,929 | 7 | 9 | |
| 1977 | 6th Lok Sabha | 744,862 | 0 | 10 | |
| 1980 | 7th Lok Sabha | 1,426,261 | 5 | 10 | |
| 1984 | 8th Lok Sabha | 2,787,655 | 10 | 10 | 10 |
| 1989 | 9th Lok Sabha | 2,816,831 | 4 | 10 | |
| 1991 | 10th Lok Sabha | 2,310,003 | 9 | 10 | |
| 1996 | 11th Lok Sabha | 1,723,087 | 2 | 10 | |
| 1998 | 12th Lok Sabha | 1,965,397 | 3 | 10 | |
| 1999 | 13th Lok Sabha | 2,435,752 | 0 | 10 | |
| 2004 | 14th Lok Sabha | 3,409,950 | 9 | 10 | 10 |
| 2009 | 15th Lok Sabha | - | 9 | 10 | 10 |
| 2014 | 16th Lok Sabha | 2,634,905 | 1 | 10 | 10 |
| 2019 | 17th Lok Sabha | 36,04,106 | 0 | 10 | 10 |
Legislative Assembly Elections
| Year | Assembly Election | Votes Polled | Seats Won | Seat Change | Outcome |
|---|---|---|---|---|---|
| 1952 | 1st Assembly | 84,819 | 24 / 36 |
New | Government |
| 1967 | 2nd Assembly | 323,247 | 34 / 60 |
10 | Government |
| 1972 | 3rd Assembly | 467,592 | 53 / 68 |
19 | Government |
| 1977 | 4th Assembly | 314,780 | 9 / 68 |
44 | Opposition |
| 1982 | 5th Assembly | 659,239 | 31 / 68 |
22 | Government |
| 1985 | 6th Assembly | 910,053 | 58 / 68 |
27 | Government |
| 1990 | 7th Assembly | 750,885 | 9 / 68 |
49 | Opposition |
| 1993 | 8th Assembly | 1,135,203 | 52 / 68 |
43 | Government |
| 1998 | 9th Assembly | 1,110,055 | 31 / 68 |
21 | Opposition |
| 2003 | 10th Assembly | 1,251,414 | 43 / 68 |
12 | Government |
| 2007 | 11th Assembly | 1,252,955 | 23 / 68 |
20 | Opposition |
| 2012 | 12th Assembly | 1,447,319 | 36 / 68 |
13 | Government |
| 2017 | 13th Assembly | 1,577,450 | 21 / 68 |
15 | Opposition |
| 2022 | 14th Assembly | 1,852,504 | 40 / 68 |
19 | Government |
| Year | General Election | Votes Polled | Seats Won | Seat Change | Outcome |
|---|---|---|---|---|---|
| 1951 | 1st Lok Sabha | 117,036 | 3 | 3 | Government |
| 1957 | 2nd Lok Sabha | 171,591 | 4 | 1 | Government |
| 1962 | 3rd Lok Sabha | 166,749 | 4 | Government | |
| 1967 | 4th Lok Sabha | 375,578 | 6 | 2 | Government (1967–69),Coalition (1969–71) |
| 1971 | 5th Lok Sabha | 516,959 | 4 | 2 | Government |
| 1977 | 6th Lok Sabha | 439,398 | 0 | 4 | Opposition |
| 1980 | 7th Lok Sabha | 653,018 | 4 | 4 | Government |
| 1984 | 8th Lok Sabha | 942,657 | 4 | Government | |
| 1989 | 9th Lok Sabha | 789,804 | 1 | 3 | Opposition |
| 1991 | 10th Lok Sabha | 808,659 | 2 | 1 | Government |
| 1996 | 11th Lok Sabha | 1,097,007 | 4 | 2 | Opposition, later outside support for UF |
| 1998 | 12th Lok Sabha | 997,410 | 1 | 3 | Opposition |
| 1999 | 13th Lok Sabha | 843,225 | 0 | 1 | Opposition |
| 2004 | 14th Lok Sabha | 1,294,988 | 3 | 3 | Coalition |
| 2009 | 15th Lok Sabha | 1,226,933 | 1 | 2 | Coalition |
| 2014 | 16th Lok Sabha | 1,260,477 | 0 | 1 | Opposition |
| 2019 | 17th Lok Sabha | 10,51,113 | 0 | Opposition |
Legislative Assembly Elections
As Jammu Kashmir State
| Year | Legislative Election | Votes Polled | Seats Won | Seat Contested | Total Seats |
|---|---|---|---|---|---|
| 1957 | Constituent Assembly | ||||
| 1957 | 1st Assembly | Didn't Contest | 75 | ||
| 1962 | 2nd Assembly | Didn't Contest | 75 | ||
| 1967 | 3rd Assembly | 423,922 | 61 | 75 | |
| 1972 | 4th Assembly | 764,492 | 58 | 75 | |
| 1977 | 5th Assembly | 294,911 | 11 | 76 | |
| 1983 | 6th Assembly | 666,112 | 26 | 76 | |
| 1987 | 7th Assembly | 525,261 | 26 | 76 | |
| 1996 | 8th Assembly | 496,628 | 7 | 87 | |
| 2002 | 9th Assembly | 643,751 | 20 | 87 | |
| 2008 | 10th Assembly | - | 17 | 87 | |
| 2014 | 11th Assembly | 867,883 | 12 | 87 |
| Year | General Election | Votes Polled | Seats Won | Seat Contested | Total Seats |
|---|---|---|---|---|---|
| 1967 | 4th Lok Sabha | 425,668 | 5 | 6 | |
| 1971 | 5th Lok Sabha | 630,690 | 5 | 6 | |
| 1977 | 6th Lok Sabha | 233,144 | 3 | 6 | |
| 1980 | 7th Lok Sabha | 249,760 | 1 | 6 | |
| 1984 | 8th Lok Sabha | 661,435 | 3 | 6 | |
| 1989 | 9th Lok Sabha | 407,474 | 2 | 6 | |
| 1989 | 9th Lok Sabha | No Elections | |||
| 1996 | 11th Lok Sabha | 569,942 | 4 | 6 | |
| 1998 | 12th Lok Sabha | 415,354 | 1 | 6 | |
| 1999 | 13th Lok Sabha | 280,065 | 0 | 6 | |
| 2004 | 14th Lok Sabha | 623,182 | 2 | 6 | |
| 2009 | 15th Lok Sabha | - | 2 | 6 | |
| 2014 | 16th Lok Sabha | - | 0 | 6 | |
| 2019 | 17th Lok Sabha | 10,11,527 | 0 | 5 | 6 |
As Jammu and Kashmir Union Territory
This section is empty. You can help by adding to it. (June 2021)
Legislative Assembly Elections
| Year | General Election | Votes Polled | Seats Won | Seat Contested | Total Seats |
|---|---|---|---|---|---|
| 2000 | 1st Assembly | Constituted on the Basis of the Bihar Legislative Assembly Elections 2000. | 81 | ||
| 2005 | 2st Assembly | 1,220,498 | 9 | 41 | 81 |
| 2009 | 3rd Assembly | 1,660,977 | 14 | - | 81 |
| 2014 | 4th Assembly | 1,450,640 | 6 | - | 81 |
| 2019 | 5th Assembly | 2,088,863 | 16 | 31 | 81 |
| Year | General Election | Votes Polled | Seats Won | Seat Contested | Total Seats |
|---|---|---|---|---|---|
| 2004 | 14th Lok Sabha | 2,007,334 | 6 | - | 14 |
| 2009 | 15th Lok Sabha | - | 1 | - | 14 |
| 2014 | 16th Lok Sabha | - | 0 | - | 14 |
| 2019 | 17th Lok Sabha | 23,38,538 | 1 | 9 | 14 |
Legislative Assembly Elections
As Mysore
| Year | General Election | Votes Polled | Vote Percent | Seat Contested | Seats Won | Seat Change | Outcome |
|---|---|---|---|---|---|---|---|
| 1951 | 1st Assembly | 1,276,318 | N.A. | 99 | 74 / 99 |
74 | Government |
| 1957 | 2nd Assembly | 3,343,839 | N.A. | 207 | 150 / 208 |
76 | Government |
| 1962 | 3rd Assembly | 3,164,811 | N.A. | N.A. | 138 / 208 |
12 | Government |
| 1967 | 4th Assembly | 3,636,374 | N.A. | N.A. | 126 / 216 |
12 | Government |
| 1972 | 5th Assembly | 4,698,824 | N.A. | N.A. | 165 / 216 |
39 | Government |
As Karnataka
| Year | General Election | Votes Polled | Vote Percent | Seat Contested | Seats Won | Seat Change | Outcome |
|---|---|---|---|---|---|---|---|
| 1978 | 6th Assembly | 5,543,756 | 44.25% | 214 | 149 / 224 |
16 | Government |
| 1983 | 7th Assembly | 5,221,419 | 40.42% ( 3.83%) | 221 | 82 / 224 |
67 | Opposition |
| 1985 | 8th Assembly | 6,009,461 | 40.82% ( 0.4%) | 223 | 65 / 224 |
2 | Opposition |
| 1989 | 9th Assembly | 7,990,142 | 43.76% ( 3.34%) | 221 | 178 / 224 |
113 | Government |
| 1994 | 10th Assembly | 5,580,473 | 29.95% ( 13.81%) | 221 | 34 / 224 |
144 | Opposition |
| 1999 | 11th Assembly | 9,077,815 | 40.84%( 10.89%) | 222 | 132 / 224 |
98 | Government |
| 2004 | 12th Assembly | 8,861,959 | 35.27% ( 5.57%) | 224 | 65 / 224 |
67 | 2 Years Coalition Government with JDS |
| 2008 | 13th Assembly | N.A. | 35.13% ( 0.14%) | N.A. | 80 / 224 |
15 | Opposition |
| 2013 | 14th Assembly | 11,473,025 | 36.6% ( 1.8%) | 223 | 122 / 224 |
42 | Government |
| 2018 | 15th Assembly | 13,986,526 | 38.14% ( 1.4%) | N.A. | 80 / 224 |
42 | Coalition Government With JDS |
| 2023 | 16th Assembly | 16,789,272 | 42.88% ( 4.74%) | 223 | 135 / 224 |
55 |
Government |
As Mysore
| Year | General Election | Votes Polled | Seats Won | Seat Contested | Total Seats |
|---|---|---|---|---|---|
| 1951 | 1st Lok Sabha | 1,509,075 | 10 | - | 11 |
| 1957 | 2nd Lok Sabha | 3,219,014 | 23 | - | 26 |
| 1962 | 3rd Lok Sabha | 3,381,276 | 25 | - | 26 |
| 1967 | 4th Lok Sabha | 3,755,339 | 18 | - | 27 |
| 1971 | 5th Lok Sabha | 5,418,541 | 27 | 27 | 27 |
As Karnataka
| Year | General Election | Votes Polled | Seats Won | Seat Contested | Total Seats |
|---|---|---|---|---|---|
| 1977 | 6th Lok Sabha | 5,833,567 | 26 | - | 28 |
| 1980 | 7th Lok Sabha | 6,154,746 | 27 | - | 28 |
| 1984 | 8th Lok Sabha | 6,974,044 | 24 | - | 28 |
| 1989 | 9th Lok Sabha | 9,008,980 | 27 | 28 | 28 |
| 1991 | 10th Lok Sabha | 6,490,020 | 23 | - | 28 |
| 1996 | 11th Lok Sabha | 5,668,988 | 5 | - | 28 |
| 1998 | 12th Lok Sabha | 7,642,756 | 9 | - | 28 |
| 1999 | 13th Lok Sabha | 10,150,765 | 18 | - | 28 |
| 2004 | 14th Lok Sabha | 9,247,605 | 8 | - | 28 |
| 2009 | 15th Lok Sabha | N.A. | 6 | - | 28 |
| 2014 | 16th Lok Sabha | N.A. | 9 | - | 28 |
| 2019 | 17th Lok Sabha | 1,12,03,016 | 1 | 20 | 28 |
Legislative Assembly Elections
As Travancore-Cochin
| Year | General Election | Votes Polled | Seats Won | Seat Contested | Total Seats |
|---|---|---|---|---|---|
| 1951 | 1st Assembly | 1,204,364 | 44 | 105 | 108 |
| 1954 | 2nd Assembly | 1,762,820 | 45 | 115 | 117 |
As Kerala
| Year | General Election | Votes Polled | Seats | Seat Contested | Seat Change | Result |
|---|---|---|---|---|---|---|
| 1957 | 1st Assembly | 2,209,251 | 43 / 126 |
124 | -- | Opposition |
| 1960 | 2nd Assembly | 2,789,556 | 63 / 126 |
80 | 20 | Government |
| 1965 | 3rd Assembly | 2,123,660 | 36 / 133 |
133 | 27 | Hung Assembly |
| 1967 | 3rd Assembly | 2,225,026 | 9 / 133 |
133 | 27 | Opposition |
| 1970 | 4th Assembly | 1,327,270 | 30 / 133 |
- | 21 | Government |
| 1977 | 5th Assembly | 1,755,882 | 38 / 140 |
- | 8 | Government |
| 1980 | 6th Assembly | 1,624,446 | 17 / 140 |
- | 21 | Opposition |
| 1982 | 7th Assembly | 1,137,632 | 20 / 140 |
36 | 3 | Government |
| 1987 | 8th Assembly | 3,164,409 | 33 / 140 |
76 | 13 | Opposition |
| 1991 | 9th Assembly | 4,546,379 | 55 / 140 |
91 | 22 | Government |
| 1996 | 10th Assembly | 4,340,717 | 37 / 140 |
94 | 18 | Opposition |
| 2001 | 11th Assembly | 4,940,883 | 63 / 140 |
88 | 25 | Government |
| 2006 | 12th Assembly | 3,744,784 | 24 / 140 |
- | 47 | Opposition |
| 2011 | 13th Assembly | 4,667,520 | 38 / 140 |
82 | 14 | Government |
| 2016 | 14th Assembly | 4,794,793 | 22 / 140 |
87 | 17 | Opposition |
| 2021 | 15th Assembly | 5,233,429 | 21 / 140 |
93 | 1 | Opposition |
As Travancore-Cochin
| Year | General Election | Votes Polled | Seats Won | Seat Contested | Total Seats |
|---|---|---|---|---|---|
| 1951 | 1st Lok Sabha | 1,224,533 | 6 |
Kerala
| Year | General Election | Votes Polled | Seats Won | Seat Contested | Total Seats |
|---|---|---|---|---|---|
| 1957 | 2nd Lok Sabha | 2,102,883 | 6 | ||
| 1962 | 3rd Lok Sabha | 1,895,226 | 6 | ||
| 1967 | 4th Lok Sabha | 2,267,393 | 1 | ||
| 1971 | 5th Lok Sabha | 1,289,601 | 6 | ||
| 1977 | 6th Lok Sabha | 2,579,745 | 11 | ||
| 1980 | 7th Lok Sabha | 2,150,186 | 5 | ||
| 1984 | 8th Lok Sabha | 3,624,315 | 13 | ||
| 1989 | 9th Lok Sabha | 6,218,850 | 14 | ||
| 1991 | 10th Lok Sabha | 5,526,187 | 13 | ||
| 1996 | 11th Lok Sabha | 5,467,132 | 7 | ||
| 1998 | 12th Lok Sabha | 5,746,566 | 8 | ||
| 1999 | 13th Lok Sabha | 6,051,905 | 8 | ||
| 2004 | 14th Lok Sabha | 4,846,637 | 0 | 17 | 20 |
| 2009 | 15th Lok Sabha | 6,434,486 | 13 | - | 20 |
| 2014 | 16th Lok Sabha | 5,590,285 | 8 | 15 | 20 |
| 2019 | 17th Lok Sabha | 7,596,610 | 15 | 16 | 20 |
General Election
| Year | General Election | Votes Polled | Seats Won | Seat Contested | Total Seats |
|---|---|---|---|---|---|
| 1967 | 4th Lok Sabha | Didn't Contest | |||
| 1971 | 5th Lok Sabha | Candidate Elected Unopposed | 1 | 1 | 1 |
| 1977 | 6th Lok Sabha | 9,600 | 1 | 1 | 1 |
| 1980 | 7th Lok Sabha | 685 | 0 | 1 | 1 |
| 1984 | 8th Lok Sabha | 10,361 | 1 | 1 | 1 |
| 1989 | 9th Lok Sabha | 13,323 | 1 | 1 | 1 |
| 1991 | 10th Lok Sabha | 12,801 | 1 | 1 | 1 |
| 1996 | 11th Lok Sabha | 15,611 | 1 | 1 | 1 |
| 1998 | 12th Lok Sabha | 16,014 | 1 | 1 | 1 |
| 1999 | 13th Lok Sabha | 16,113 | 1 | 1 | 1 |
| 2004 | 14th Lok Sabha | 15,526 | 0 | 1 | 1 |
| 2009 | 15th Lok Sabha | 20,492 | 1 | 1 | 1 |
| 2014 | 16th Lok Sabha | 20,130 | 0 | 1 | 1 |
| 2019 | 17th Lok Sabha | 22,028 | 0 | 1 | 1 |
Legislative Assembly Elections
| Year | Assembly Election | Votes Polled | Seats Won | Seat Contested | Total Seats |
|---|---|---|---|---|---|
| 1951 | 1st Assembly | 3,434,058 | 194 | 225 | 232 |
| 1957 | 2nd Assembly | 3,691,999 | 232 | 288 | 288 |
| 1962 | 3rd Assembly | 2,527,257 | 142 | 288 | 288 |
| 1967 | 4th Assembly | 3,700,686 | 167 | 296 | 320 |
| 1972 | 5th Assembly | 5,219,823 | 220 | 289 | 320 |
| 1977 | 6th Assembly | 4,200,717 | 84 | 320 | 320 |
| 1980 | 7th Assembly | 5,741,077 | 246 | 320 | 320 |
| 1985 | 8th Assembly | 6,937,747 | 250 | 320 | 320 |
| 1990 | 9th Assembly | 6,634,518 | 56 | 318 | 320 |
| 1993 | 10th Assembly | 9,628,464 | 174 | 318 | 320 |
| 1998 | 11th Assembly | 10,778,985 | 172 | 316 | 320 |
| 2003 | 12th Assembly | 8,059,414 | 38 | 228 | 230 |
| 2008 | 13th Assembly | 8,170,318 | 71 | 228 | 230 |
| 2013 | 14th Assembly | 12,315,253 | 58 | 230 | 230 |
| 2018 | 15th Assembly | 15,595,696 | 114 | 229 | 230 |
| 2023 | 16th Assembly | 17,188,236 | 66 | 230 | 230 |
| Year | General Election | Votes Polled | Seats Won | Seat Contested | Total Seats |
|---|---|---|---|---|---|
| 1951 | 1st Lok Sabha | 3,713,537 | 27 | - | 28 |
| 1957 | 2nd Lok Sabha | 3,967,199 | 34 | - | 35 |
| 1962 | 3rd Lok Sabha | 2,651,882 | 24 | - | 36 |
| 1967 | 4th Lok Sabha | 3,774,364 | 24 | - | 37 |
| 1971 | 5th Lok Sabha | 4,027,658 | 21 | - | 37 |
| 1977 | 6th Lok Sabha | 3,835,807 | 1 | - | 40 |
| 1980 | 7th Lok Sabha | 5,949,859 | 35 | - | 40 |
| 1984 | 8th Lok Sabha | 8,898,835 | 40 | 40 | 40 |
| 1989 | 9th Lok Sabha | 7,420,935 | 8 | - | 40 |
| 1991 | 10th Lok Sabha | 7,425,644 | 27 | - | 40 |
| 1996 | 11th Lok Sabha | 7,111,753 | 8 | - | 40 |
| 1998 | 12th Lok Sabha | 10,611,317 | 10 | - | 40 |
| 1999 | 13th Lok Sabha | 11,135,161 | 11 | - | 40 |
| 2004 | 14th Lok Sabha | 6,289,013 | 4 | - | 29 |
| 2009 | 15th Lok Sabha | - | 12 | - | 29 |
| 2014 | 16th Lok Sabha | - | 2 | 29 | 29 |
| 2019 | 17th Lok Sabha | 1,27,33,051 | 1 | 29 | 29 |
Legislative Assembly
| Year | Assembly Election | Votes Polled | Vote Percent | Seat Contested | Seats Won | Seat Change | Outcome |
|---|---|---|---|---|---|---|---|
| 1960 | 1st Assembly Constituted out of Bombay assembly (Polls held in 1957) | 8,131,604 | 48.66% 1.29% | 396 (264 Maharashtra Seats) | 234 of Total; 135 / 264 |
36 | Government |
| 1962 | 2nd Assembly | 5,617,347 | 51.22% ( 2.56%) | 264 | 215 / 264 |
80 | Government |
| 1967 | 3rd Assembly | 6,288,564 | 47.03% ( 4.19%) | 270 | 203 / 270 |
12 | Government |
| 1972 | 4th Assembly | 8,535,832 | 56.36% ( 9.33%) | 271 | 222 / 270 |
19 | Government |
| 1978 | 5th Assembly | 5,159,828 | 25.33% ( 31.03%) | 259 | 69 / 288 |
153 | Coalition Government With Rebel Congress |
| 1980 | 6th Assembly | 7,809,533 | 44.50% ( 26.16%) | 286 | 186 / 288 |
124 | Government |
| 1985 | 7th Assembly | 9,522,556 | 43.41% ( 1.09%) | 287 | 161 / 288 |
25 | Government |
| 1990 | 8th Assembly | 11,334,773 | 38.17% ( 5.24%) | 276 | 141 / 288 |
20 | Government |
| 1995 | 9th Assembly | 11,941,832 | 31% ( 7.17%) | 286 | 80 / 288 |
61 | Opposition |
| 1999 | 10th Assembly | 8,937,043 | 27.2% ( 3.8%) | 249 | 75 / 288 |
5 | Coalition Government With NCP |
| 2004 | 11th Assembly | 8,810,363 | 21.06% ( 6.14%) | 157 | 69 / 288 |
6 | Coalition Government With NCP |
| 2009 | 12th Assembly | 9,521,703 | 21.01% ( 0.05%) | 170 | 82 / 288 |
13 | Coalition Government With NCP |
| 2014 | 13th Assembly | 9,496,095 | 17.95% ( 3.06%) | 287 | 42 / 288 |
40 | Opposition |
| 2019 | 14th Assembly | 8,752,199 | 15.87% ( 2.17%) | 147 | 44 / 288 |
2 | Coalition Government With SHS and NCP |
Legislative Assembly
| Year | Assembly Election | Votes Polled | Seats Won | Seat Contested | Total Seats |
|---|---|---|---|---|---|
| 1967 | 1st Assembly | 101,504 | 16 | - | 30 |
| 1972 | 2nd Assembly | 135,678 | 17 | - | 60 |
| 1974 | 3rd Assembly | 164,717 | 13 | - | 60 |
| 1980 | 4th Assembly | 158,127 | 13 | - | 60 |
| 1984 | 5th Assembly | 257,809 | 30 | - | 60 |
| 1990 | 6th Assembly | 333,765 | 24 | - | 60 |
| 1995 | 7th Assembly | 328,362 | 22 | - | 60 |
| 2000 | 8th Assembly | 230,748 | 11 | - | 60 |
| 2002 | 9th Assembly | 345,660 | 20 | - | 60 |
| 2007 | 10th Assembly | 345,660 | 30 | - | 60 |
| 2012 | 11th Assembly | 592,566 | 42 | - | 60 |
| 2017 | 12th Assembly | 582,056 | 28 | - | 60 |
| 2022 | 13th Assembly | 312,659 | 5 | 53 | 60 |
| Year | General Election | Votes Polled | Seats Won | Seat Contested | Total Seats |
|---|---|---|---|---|---|
| 1951 | 1st Lok Sabha | 36,317 | 1 | - | 2 |
| 1957 | 2nd Lok Sabha | 48,687 | 1 | - | 2 |
| 1962 | 3rd Lok Sabha | 81,860 | 1 | - | 2 |
| 1967 | 4th Lok Sabha | 103,010 | 0 | - | 2 |
| 1971 | 5th Lok Sabha | 77,974 | 2 | 2 | 2 |
| 1977 | 6th Lok Sabha | 210,851 | 2 | 2 | 2 |
| 1980 | 7th Lok Sabha | 164,473 | 1 | - | 2 |
| 1984 | 8th Lok Sabha | 294,002 | 2 | 2 | 2 |
| 1989 | 9th Lok Sabha | 387,829 | 2 | - | 2 |
| 1991 | 10th Lok Sabha | 325,023 | 1 | - | 2 |
| 1996 | 11th Lok Sabha | 385,206 | 2 | 2 | 2 |
| 1998 | 12th Lok Sabha | 139,434 | 0 | - | 2 |
| 1999 | 13th Lok Sabha | 226,047 | 0 | - | 2 |
| 2004 | 14th Lok Sabha | 154,055 | 1 | 1 | 2 |
| 2009 | 15th Lok Sabha | - | 2 | 2 | 2 |
| 2014 | 16th Lok Sabha | - | 2 | 2 | 2 |
| 2019 | 17th Lok Sabha | 398,387 | 0 | 2 | 2 |
Legislative Assembly
| Year | Assembly Election | Votes Polled | Seats Won | Seat Contested | Total Seats |
|---|---|---|---|---|---|
| 1972 | 1st Assembly | 20,474 | 9 | - | 60 |
| 1978 | 2nd Assembly | 109,654 | 20 | - | 60 |
| 1983 | 3rd Assembly | 130,956 | 25 | - | 60 |
| 1988 | 4th Assembly | 198,028 | 22 | - | 60 |
| 1993 | 5th Assembly | 282,139 | 24 | - | 60 |
| 1998 | 6th Assembly | 293,346 | 25 | - | 60 |
| 2003 | 7th Assembly | 270,269 | 22 | - | 60 |
| 2008 | 8th Assembly | 357,113 | 25 | 59 | 60 |
| 2009 | 9th Assembly | 458,783 | 29 | 60 | 60 |
| 2018 | 10th Assembly | 447,472 | 21 | 59 | 60 |
| 2023 | 11th Assembly | 243,841 | 5 | 60 | 60 |
| Year | General Election | Votes Polled | Seats Won | Seat Contested | Total Seats |
|---|---|---|---|---|---|
| 1977 | 6th Lok Sabha | 91,255 | 1 | - | 2 |
| 1980 | 7th Lok Sabha | 82,307 | 1 | - | 2 |
| 1984 | 8th Lok Sabha | 249,266 | 2 | 2 | 2 |
| 1989 | 9th Lok Sabha | 264,210 | 2 | 2 | 2 |
| 1991 | 10th Lok Sabha | 281,562 | 2 | 2 | 2 |
| 1996 | 11th Lok Sabha | 353,327 | 1 | 2 | 2 |
| 1998 | 12th Lok Sabha | 399,583 | 2 | 2 | 2 |
| 1999 | 13th Lok Sabha | 214,324 | 1 | 2 | 2 |
| 2004 | 14th Lok Sabha | 309,233 | 1 | 2 | 2 |
| 2009 | 15th Lok Sabha | - | 1 | 1 | 2 |
| 2014 | 16th Lok Sabha | - | 1 | 1 | 2 |
| 2019 | 17th Lok Sabha | 6,60,114 | 1 | 2 | 2 |
Legislative Assembly
| Year | Assembly Election | Votes Polled | Seats Won | Seat Contested | Total Seats | Outcome |
|---|---|---|---|---|---|---|
| 1972 | 1st Assembly | 34,421 | 6 | 29 | 30 | Opposition |
| 1978 | 2nd Assembly | - | - | - | - | |
| 1979 | 3rd Assembly | 39,115 | 5 | 25 | 30 | Opposition |
| 1984 | 4th Assembly | 74,005 | 20 | 30 | 30 | Government |
| 1987 | 5th Assembly | 76,152 | 13 | 40 | 40 | Opposition |
| 1989 | 6th Assembly | 93,561 | 23 | 34 | 40 | Government |
| 1993 | 7th Assembly | 106,320 | 16 | 28 | 40 | Government |
| 1998 | 8th Assembly | 100,608 | 6 | 40 | 40 | Opposition |
| 2003 | 9th Assembly | 125,690 | 12 | 40 | 40 | Opposition |
| 2008 | 10th Assembly | 195,614 | 32 | 40 | 40 | Government |
| 2013 | 11th Assembly | 255,917 | 34 | 40 | 40 | Government |
| 2018 | 12th Assembly | 190,412 | 5 | 40 | 40 | Opposition |
| 2023 | 13th Assembly | 146,113 | 1 | 40 | 40 | Opposition |
| Year | General Election | Votes Polled | Seats Won | Seat Contested | Total Seats |
|---|---|---|---|---|---|
| 1977 | 6th Lok Sabha | 37,342 | 0 | 1 | 1 |
| 1989 | 9th Lok Sabha | 109,571 | 1 | 1 | 1 |
| 1991 | 10th Lok Sabha | 91,612 | 1 | 1 | 1 |
| 1996 | 11th Lok Sabha | 126,191 | 1 | 1 | 1 |
| 1998 | 12th Lok Sabha | 106,511 | 0 | 1 | 1 |
| 1999 | 11th Lok Sabha | - | - | - | 1 |
| 2004 | 14th Lok Sabha | - | - | - | 1 |
| 2009 | 15th Lok Sabha | - | 1 | 1 | 1 |
| 2014 | 16th Lok Sabha | - | 1 | 1 | 1 |
| 2019 | 17th Lok Sabha | - | tbc | tbc | 1 |
Legislative Assembly
| Year | Assembly Election | Votes Polled | Seats Won | Seat Contested | Total Seats |
|---|---|---|---|---|---|
| 1964 | 1st Assembly | - | - | - | 40 |
| 1969 | 2nd Assembly | - | - | - | 40 |
| 1974 | 3rd Assembly | - | - | - | 40 |
| 1977 | 4th Assembly | 65,616 | 15 | - | 60 |
| 1982 | 5th Assembly | 140,420 | 24 | - | 60 |
| 1987 | 6th Assembly | 193,199 | 34 | - | 60 |
| 1989 | 7th Assembly | 253,792 | 36 | - | 60 |
| 1993 | 8th Assembly | 335,834 | 35 | - | 60 |
| 1998 | 9th Assembly | 103,206 | 53 | - | 60 |
| 2003 | 10th Assembly | 318,671 | 21 | - | 60 |
| 2008 | 11th Assembly | 411,100 | 23 | - | 60 |
| 2013 | 12h Assembly | 272,515 | 8 | - | 60 |
| 2018 | 13th Assembly | 20,752 | 0 | 18 | 60 |
| 2023 | 14th Assembly | 40,810 | 0 | 23 | 60 |
| Year | General Election | Votes Polled | Seats Won | Seat Contested | Total Seats |
|---|---|---|---|---|---|
| 1977 | 6th Lok Sabha | 116,527 | 0 | 0 | 1 |
| 1984 | 8th Lok Sabha | 251,101 | 1 | 1 | 1 |
| 1989 | 9th Lok Sabha | 363,071 | 1 | 1 | 1 |
| 1991 | 10th Lok Sabha | 276,161 | 0 | 1 | 1 |
| 1996 | 11th Lok Sabha | 472,102 | 1 | 1 | 1 |
| 1998 | 12th Lok Sabha | 344,223 | 1 | 1 | 1 |
| 1999 | 13th Lok Sabha | 516,119 | 1 | 1 | 1 |
| 2004 | 14th Lok Sabha | 246,109 | 0 | 1 | 1 |
| 2009 | 15th Lok Sabha | 349,203 | 0 | 1 | 1 |
| 2014 | 16th Lok Sabha | 313,147 | 0 | 1 | 1 |
| 2019 | 17th Lok Sabha | 4,84,166 | 0 | 1 | 1 |
| Year | Assembly Election | Votes Polled | Seats Won | Seat Contested | Total Seats |
|---|---|---|---|---|---|
| 1951 | 1st Assembly | 1,392,501 | 67 | 135 | 140 |
| 1957 | 2nd Assembly | 1,628,180 | 56 | 140 | 140 |
| 1961 | 3rd Assembly | 1,269,000 | 82 | 140 | 140 |
| 1967 | 4th Assembly | 1,235,149 | 31 | 140 | 140 |
| 1971 | 5th Assembly | 1,240,668 | 51 | 129 | 140 |
| 1974 | 6th Assembly | 2,152,818 | 69 | 135 | 146 |
| 1977 | 7th Assembly | 1,594,505 | 26 | 146 | 147 |
| 1980 | 8th Assembly | 3,037,487 | 118 | 147 | 147 |
| 1985 | 9th Assembly | 4,007,258 | 117 | 147 | 147 |
| 1990 | 10th Assembly | 3,264,000 | 10 | 145 | 147 |
| 1995 | 11th Assembly | 6,180,237 | 80 | 146 | 147 |
| 2000 | 12th Assembly | 4,770,654 | 26 | 145 | 147 |
| 2004 | 13th Assembly | 5,896,713 | 38 | 134 | 147 |
| 2009 | 14th Assembly | - | 17 | 145 | 147 |
| 2014 | 15th Assembly | 5,535,670 | 16 | - | 147 |
| 2019 | 16th Assembly | 37,75,320 | 9 | 147 | 147 |
| Year | General Election | Votes Polled | Seats Won | Seat Contested | Total Seats |
|---|---|---|---|---|---|
| 1951 | 1st Lok Sabha | 1,555,787 | 11 | - | 20 |
| 1957 | 2nd Lok Sabha | 1,776,767 | 7 | - | 20 |
| 1962 | 3rd Lok Sabha | 1,093,297 | 14 | - | 20 |
| 1967 | 4th Lok Sabha | 1,353,704 | 6 | - | 20 |
| 1971 | 5th Lok Sabha | 1,716,021 | 15 | - | 20 |
| 1977 | 6th Lok Sabha | 2,059,490 | 4 | - | 21 |
| 1980 | 7th Lok Sabha | 3,451,255 | 20 | - | 21 |
| 1984 | 8th Lok Sabha | 4,692,933 | 20 | - | 21 |
| 1989 | 9th Lok Sabha | 4,298,516 | 3 | - | 21 |
| 1991 | 10th Lok Sabha | 4,598,809 | 13 | - | 21 |
| 1996 | 11th Lok Sabha | 5,850,025 | 17 | - | 21 |
| 1998 | 12th Lok Sabha | 5,477,410 | 5 | - | 21 |
| 1999 | 13th Lok Sabha | 4,901,186 | 2 | - | 21 |
| 2004 | 14th Lok Sabha | 6,845,738 | 2 | - | 21 |
| 2009 | 15th Lok Sabha | - | 6 | - | 21 |
| 2014 | 16th Lok Sabha | - | 0 | - | 21 |
| 2019 | 17th Lok Sabha | 32,85,192 | 1 | 21 | 21 |
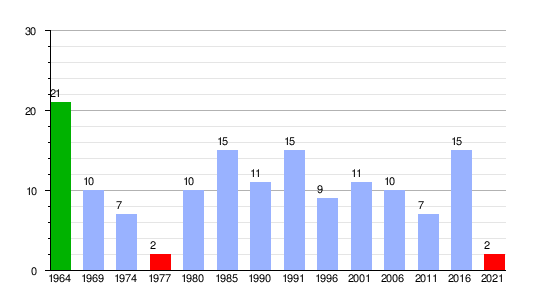
Legislative Assembly
| Electoral performance of Congress in Puducherry Assembly |
|
| Highest seats in Year:1964 Lowest seats in Year:1977, 2021 |
| Year | Assembly Election | Votes Polled | Seats Won | Seat Contested | Total Seats | Outcome |
|---|---|---|---|---|---|---|
| 1963[note 1] | 1st Assembly | N.A. | 21 | 39 | 39 | Government |
| 1964 | 2nd Assembly | 91,338 | 22 | 30 | 30 | Government |
| 1969 | 3rd Assembly | - | 10 | - | 30 | |
| 1974 | 4th Assembly | - | 7 | - | 30 | |
| 1977 | 5th Assembly | 39,343 | 2 | - | 30 | |
| 1980 | 6th Assembly | 58,680 | 10 | - | 30 | |
| 1985 | 7th Assembly | 98,601 | 15 | - | 30 | Government |
| 1990 | 8th Assembly | 105,207 | 11 | - | 30 | |
| 1991 | 9th Assembly | 117,289 | 15 | - | 30 | Government |
| 1996 | 10th Assembly | 116,618 | 9 | - | 30 | |
| 2001 | 11th Assembly | 108,700 | 11 | - | 30 | Government |
| 2006 | 12th Assembly | 10 | - | 30 | Government | |
| 2011 | 13th Assembly | 7 | 17 | 30 | Opposition | |
| 2016 | 14th Assembly | 244,886 | 15 | 21 | 30 | Government |
| 2021 | 15th Assembly | 2 | 14 | 30 |
| Year | General Election | Votes Polled | Seats Won | Seat Contested | Total Seats |
|---|---|---|---|---|---|
| 1980 | 7th Lok Sabha | 164,589 | 1 | 1 | 1 |
| 1984 | 8th Lok Sabha | 159,376 | 1 | 1 | 1 |
| 1989 | 9th Lok Sabha | 190,562 | 1 | 1 | 1 |
| 1991 | 10th Lok Sabha | 207,922 | 1 | 1 | 1 |
| 1996 | 11th Lok Sabha | 1,986 | 1 | 1 | 1 |
| 1998 | 12th Lok Sabha | 131,348 | 0 | 1 | 1 |
| 1999 | 13th Lok Sabha | 165,108 | 1 | 1 | 1 |
| 2004 | 13th Lok Sabha | - | 1 | 1 | 1 |
| 2009 | 15th Lok Sabha | - | 1 | 1 | 1 |
| 2014 | 16th Lok Sabha | - | 0 | 1 | 1 |
| 2019 | 17th Lok Sabha | 444,981 | 1 | 1 | 1 |
Legislative Assembly Election
| Year | Assembly Election | Votes Polled | Vote Percent | Seats Won | Seat Change | Outcome |
|---|---|---|---|---|---|---|
| 1951 | 1st Assembly | 1,830,601 | N.A. | 96 / 126 |
96 | Government |
| 1957 | 2nd Assembly | 3,612,709 | N.A. | 120 / 154 |
24 | Government |
| 1962 | 3rd Assembly | 2,946,209 | N.A. | 90 / 154 |
30 | Government |
| 1967 | 4th Assembly | 1,594,160 | N.A. | 48 / 104 |
42 | Opposition |
| 1969 | 5th Assembly | 1,844,360 | N.A. | 38 / 104 |
10 | Opposition |
| 1972 | 6th Assembly | 2,083,390 | N.A. | 66 / 104 |
28 | Government |
| 1977 | 7th Assembly | 1,899,534 | N.A. | 17 / 117 |
49 | Opposition |
| 1980 | 8th Assembly | 2,825,827 | N.A. | 63 / 117 |
46 | Government |
| 1985 | 9th Assembly | 2,620,042 | N.A. | 32 / 117 |
31 | Opposition |
| 1992 | 10th Assembly | 1,317,075 | N.A. | 87 / 117 |
55 | Government |
| 1997 | 11th Assembly | 2,736,346 | N.A. | 14 / 117 |
73 | Opposition |
| 2002 | 12th Assembly | 3,682,877 | N.A. | 62 / 117 |
48 | Government |
| 2007 | 13h Assembly | 5,170,548 | 40.90% | 44 / 117 |
18 | Opposition |
| 2012 | 14th Assembly | 5,572,643 | 40.11% ( 0.79%) | 46 / 117 |
2 | Opposition |
| 2017 | 15th Assembly | 5,945,899 | 38.64% ( 1.46%) | 77 / 117 |
31 | Government |
| 2022 | 16th Assembly | 3,576,684 | 22.98% ( 15.66%) | 18 / 117 |
59 | Opposition |
| Year | General Election | Votes Polled | Seats Won | Seat Contested | Change |
|---|---|---|---|---|---|
| 1951 | 1st Lok Sabha | 2,134,586 | 16 | - | - |
| 1957 | 2nd Lok Sabha | 3,682,219 | 21 | - | - |
| 1962 | 3rd Lok Sabha | 2,802,692 | 14 | - | - |
| 1967 | 4th Lok Sabha | 1,598,546 | 9 | - | - |
| 1971 | 5th Lok Sabha | 1,873,862 | 10 | - | - |
| 1977 | 6th Lok Sabha | 1,955,485 | 0 | - | - |
| 1980 | 7th Lok Sabha | 3,133,473 | 12 | - | - |
| 1985 | 8th Lok Sabha | 2,879,089 | 6 | - | - |
| 1989 | 9th Lok Sabha | 2,103,712 | 2 | - | - |
| 1992 | 10th Lok Sabha | 1,486,289 | 12 | - | - |
| 1996 | 11th Lok Sabha | 3,098,956 | 2 | - | - |
| 1998 | 12th Lok Sabha | 2,356,281 | 0 | - | - |
| 1999 | 13th Lok Sabha | 3,365,176 | 2 | - | - |
| 2004 | 14th Lok Sabha | 3,495,187 | 2 / 13 |
13 | |
| 2009 | 15th Lok Sabha | - | 8 / 13 |
13 | 6 |
| 2014 | 16th Lok Sabha | - | 3 / 13 |
13 | 5 |
| 2019 | 17th Lok Sabha | 5,523,066 | 8 / 13 |
13 | 5 |
| 2024 | 18th Lok Sabha | 3,543,824 | 7 / 13 |
13 | 1 |
Legislative Assembly Elections
| Year | Assembly Election | Votes Polled | Vote Percent | Seat Contested | Seats Won | Seat Change | Outcome |
|---|---|---|---|---|---|---|---|
| 1951 | 1st Assembly | 1,286,953 | 51.25% | 156 | 82 / 160 |
82 | Government |
| 1957 | 2nd Assembly | 2,141,931 | 67.61% | 176 | 119 / 176 |
37 | Government |
| 1962 | 3rd Assembly | 2,052,383 | 39.98% | N.A. | 88 / 176 |
31 | Government |
| 1967 | 4th Assembly | 2,798,411 | 41.42% | N.A. | 89 / 184 |
1 | Government |
| 1972 | 5th Assembly | 3,976,157 | 51.13% | N.A. | 145 / 184 |
56 | Government |
| 1977 | 6th Assembly | 2,599,772 | 31.49% | N.A. | 41 / 200 |
104 | Opposition |
| 1980 | 7th Assembly | 3,975,315 | 42.96% | N.A. | 133 / 200 |
92 | Government |
| 1985 | 8th Assembly | 5,342,920 | 46.67% | N.A. | 113 / 200 |
20 | Government |
| 1990 | 9th Assembly | 4,988,699 | 33.67% | N.A. | 50 / 200 |
63 | Opposition |
| 1993 | 10th Assembly | 6,442,721 | 38.27% | N.A. | 76 / 200 |
26 | Opposition |
| 1998 | 11th Assembly | 8,467,160 | 44.95% | N.A. | 153 / 200 |
77 | Government |
| 2003 | 12th Assembly | 8,120,605 | N.A. | 200 | 56 / 200 |
97 | Opposition |
| 2008 | 13th Assembly | 8,872,184 | 36.82% | 200 | 96 / 200 |
40 | Government |
| 2013 | 14th Assembly | 10,204,694 | 33.07% | 200 | 21 / 200 |
75 | Opposition |
| 2018 | 15th Assembly | 13,935,201 | 39.3% | 200 | 100 / 200 |
79 | Government |
| 2023 | 16th Assembly | 15,761,681 | 39.53% | 200 | 70 / 200 |
30 | Opposition |
| Year | General Election | Votes Polled | Seats Won | Seat Contested | Total Seats |
|---|---|---|---|---|---|
| 1951 | 1st Lok Sabha | 1,460,971 | 9 | - | 20 |
| 1957 | 2nd Lok Sabha | 2,494,094 | 19 | - | 22 |
| 1962 | 3rd Lok Sabha | 1,951,507 | 14 | - | 22 |
| 1967 | 4th Lok Sabha | 2,722,493 | 10 | - | 23 |
| 1971 | 5th Lok Sabha | 3,486,776 | 14 | - | 23 |
| 1977 | 6th Lok Sabha | 2,568,345 | 1 | - | 25 |
| 1980 | 7th Lok Sabha | 4,040,398 | 18 | - | 25 |
| 1984 | 8th Lok Sabha | 5,898,116 | 25 | - | 25 |
| 1989 | 9th Lok Sabha | 5,285,868 | 0 | - | 25 |
| 1991 | 10th Lok Sabha | 5,407,144 | 13 | - | 25 |
| 1996 | 11th Lok Sabha | 5,253,531 | 12 | - | 25 |
| 1998 | 12th Lok Sabha | 7,846,072 | 18 | - | 25 |
| 1999 | 13th Lok Sabha | 7,475,888 | 9 | - | 25 |
| 2004 | 14th Lok Sabha | 7,179,939 | 4 | - | 25 |
| 2009 | 15th Lok Sabha | - | 20 | - | 25 |
| 2014 | 16th Lok Sabha | - | 0 | - | 25 |
| 2019 | 17th Lok Sabha | 11,107,910 | 0 | 25 | 25 |
Legislative Assembly Election
| Year | Assembly Election | Votes Polled | Seats Won | Seat Contested | Total Seats |
|---|---|---|---|---|---|
| 1979 | 1st Assembly | 1,476 | 0 | 12 | 32 |
| 1985 | 2nd Assembly | 23,440 | 1 | 32 | 32 |
| 1989 | 3rd Assembly | 24,121 | 0 | 31 | 32 |
| 1994 | 4th Assembly | 26,045 | 2 | 31 | 32 |
| 1999 | 5th Assembly | 7,512 | 0 | 31 | 32 |
| 2004 | 6th Assembly | 51,329 | 1 | 28 | 32 |
| 2009 | 7th Assembly | 69,612 | 0 | 32 | 32 |
| 2014 | 8th Assembly | 4,390 | 0 | 32 | 32 |
| 2019 | 9th Assembly | 2,721 | 0 | 24 | 32 |
| Year | General Election | Votes Polled | Seats Won | Seat Contested | Total Seats |
|---|---|---|---|---|---|
| 1984 | 8th Lok Sabha | 21,327 | 0 | 1 | 1 |
| 1989 | 9th Lok Sabha | 28,822 | 0 | 1 | 1 |
| 1998 | 12th Lok Sabha | 51,611 | 0 | 1 | 1 |
| 1999 | 13th Lok Sabha | 9,762 | 0 | 1 | 1 |
| 2004 | 14th Lok Sabha | 60,258 | 0 | 1 | 1 |
| 2009 | 15th Lok Sabha | - | 0 | 1 | 1 |
| 2014 | 16th Lok Sabha | - | 0 | 1 | 1 |
| 2019 | 17th Lok Sabha | 3,990 | 0 | 1 | 1 |
Legislative Assembly Election
As Madras State
| Year | Assembly Election | Votes Polled | Seats Won | Seat Contested | Total Seats |
|---|---|---|---|---|---|
| 1951 | 1st Assembly | 6,988,701 | 152 | 367 | 375 |
| 1957 | 2nd Assembly | 5,046,576 | 151 | 204 | 205 |
| 1962 | 3rd Assembly | 5,848,974 | 139 | 206 | 206 |
| 1967 | 4th Assembly | 6,293,378 | 51 | 232 | 234 |
As Tamil Nadu
| Year | Assembly Election | Votes Polled | Seats Won | Seat Contested | Total Seats |
|---|---|---|---|---|---|
| 1971 | 5th Assembly | 5,513,894 | 15 | 201 | 234 |
| 1977 | 6th Assembly | 2,994,535 | 27 | 198 | 234 |
| 1980 | 7th Assembly | 3,941,900 | 31 | 114 | 234 |
| 1984 | 8th Assembly | 3,529,708 | 61 | 73 | 234 |
| 1989 | 9th Assembly | 4,780,714 | 26 | 214 | 234 |
| 1991 | 10th Assembly | 3,743,859 | 60 | 65 | 234 |
| 1996 | 11th Assembly | 1,523,340 | 0 | 64 | 234 |
| 2001 | 12th Assembly | 696,205 | 7 | 14 | 234 |
| 2006 | 13th Assembly | 2,765,768 | 34 | 48 | 234 |
| 2011 | 14th Assembly | 3,426,432 | 5 | 63 | 234 |
| 2016 | 15th Assembly | 2,774,075 | 8 | 41 | 234 |
| 2021 | 16th Assembly | 1,976,527 | 18 | 25 | 234 |
As Madras State
| Year | General Election | Votes Polled | Seats Won | Seat Contested | Total Seats |
|---|---|---|---|---|---|
| 1951 | 1st Lok Sabha | 7,253,452 | 35 | - | |
| 1957 | 2nd Lok Sabha | 5,094,552 | 31 | - | |
| 1962 | 3rd Lok Sabha | 5,623,013 | 31 | - | |
| 1967 | 4th Lok Sabha | 6,436,710 | 3 | - |
As Tamil Nadu
| Year | General Election | Votes Polled | Seats Won | Seat Contested | Total Seats |
|---|---|---|---|---|---|
| 1971 | 5th Lok Sabha | 1,995,567 | 9 | - | |
| 1977 | 6th Lok Sabha | 3,977,306 | 14 | 16 | 39 |
| 1980 | 7th Lok Sabha | 5,821,411 | 20 | 22 | 39 |
| 1984 | 8th Lok Sabha | 8,755,871 | 25 | 26 | 39 |
| 1989 | 9th Lok Sabha | 10,524,027 | 27 | 28 | 39 |
| 1991 | 10th Lok Sabha | 10,510,569 | 28 | 28 | 39 |
| 1996 | 11th Lok Sabha | 4,965,364 | 0 | 29 | 39 |
| 1998 | 12th Lok Sabha | 1,223,102 | 0 | 35 | 39 |
| 1999 | 13th Lok Sabha | 3,022,107 | 2 | 11 | 39 |
| 2004 | 14th Lok Sabha | 4,134,255 | 10 | 10 | 39 |
| 2009 | 15th Lok Sabha | - | 8 | 15 | 39 |
| 2014 | 16th Lok Sabha | - | 0 | 39 | 39 |
| 2019 | 17th Lok Sabha | 5,405,674 | 8 | 9 | 39 |
Legislative Assembly Election
| Year | Assembly Election | Votes Polled | Vote Percent | Seat Contested | Seats Won | Seat Change | Outcome |
|---|---|---|---|---|---|---|---|
| 2014 | 1st Assembly | N.A. | N.A. | N.A. | 14 / 119 |
14 | Opposition |
| 2018 | 2nd Assembly | 5,883,111 | 28.4 | 99 | 19 / 119 |
5 | Opposition |
| 2023 | 3rd Assembly | 9,235,792 | 39.40 | 118 | 64 / 119 |
45 | Government |
| Year | General Election | Votes Polled | Seats Won | Seat Contested | Total Seats |
|---|---|---|---|---|---|
| 2014 | 16th Lok Sabha | N.A. | 2 | N.A. | 17 |
| 2019 | 17th Lok Sabha | - | 3 | 17 | 17 |
Legislative Assembly Election
| Year | Assembly Election | Votes Polled | Seats Won | Seat Contested | Total Seats |
|---|---|---|---|---|---|
| 1963 | 1st Assembly | N.A. | N.A. | N.A. | N>A. |
| 1967 | 2nd Assembly | 251,345 | 27 | 30 | 30 |
| 1972 | 3rd Assembly | 224,821 | 41 | 59 | 60 |
| 1978 | 4th Assembly | 133,240 | 0 | 60 | 60 |
| 1983 | 5th Assembly | 282,859 | 12 | 45 | 60 |
| 1988 | 6th Assembly | 424,241 | 25 | 46 | 60 |
| 1993 | 7th Assembly | 438,561 | 10 | 46 | 60 |
| 1998 | 8th Assembly | 464,171 | 13 | 45 | 60 |
| 2003 | 9th Assembly | 498,749 | 13 | 60 | 60 |
| 2008 | 10th Assembly | 684,207 | 10 | 48 | 60 |
| 2013 | 11th Assembly | 804,457 | 10 | - | 60 |
| 2018 | 12th Assembly | 41,325 | 0 | 59 | 60 |
| 2023 | 13th Assembly | 216,637 | 3 | 13 | 60 |
| Year | General Election | Votes Polled | Seats Won | Seat Contested | Total Seats |
|---|---|---|---|---|---|
| 1951 | 1st Lok Sabha | Not Available | 0 | 2 | 2 |
| 1957 | 2nd Lok Sabha | Not Available | 1 | 2 | 2 |
| 1962 | 3rd Lok Sabha | Not Available | 0 | 2 | 2 |
| 1967 | 4th Lok Sabha | Not Available | 2 | 2 | 2 |
| 1971 | 5th Lok Sabha | Not Available | 0 | 2 | 2 |
| 1977 | 6th Lok Sabha | Not Available | 1 | 2 | 2 |
| 1980 | 7th Lok Sabha | Not Available | 0 | 2 | 2 |
| 1984 | 8th Lok Sabha | Not Available | 0 | 2 | 2 |
| 1989 | 9th Lok Sabha | Not Available | 2 | 2 | 2 |
| 1991 | 10th Lok Sabha | Not Available | 2 | 2 | 2 |
| 1996 | 11th Lok Sabha | Not Available | 0 | 2 | 2 |
| 1998 | 12th Lok Sabha | Not Available | 0 | 2 | 2 |
| 1999 | 13th Lok Sabha | Not Available | 0 | 2 | 2 |
| 2004 | 14th Lok Sabha | Not Available | 0 | 2 | 2 |
| 2009 | 15th Lok Sabha | Not Available | 0 | 2 | 2 |
| 2014 | 16th Lok Sabha | Not Available | 0 | 2 | 2 |
| 2019 | 17th Lok Sabha | 5,45,679 | 0 | 2 | 2 |
Legislative Assembly Elections
| Year | Legislature | Leader | Seats Contested | Seats won | Change in seats | Votes | Percentage of votes | Vote swing | Outcome |
|---|---|---|---|---|---|---|---|---|---|
| 1952 | 1st Assembly | Govind Vallabh Pant | 429 | 388 / 430 |
- | 8,032,475 | 47.93 | - | Government |
| 1957 | 2nd Assembly | Sampurnanand | 430 | 286 / 430 |
102 | 9,298,382 | 42.42 | 5.51 | Government |
| 1962 | 3rd Assembly | Chandra Bhanu Gupta | 429 | 249 / 430 |
37 | 6,471,669 | 36.35 | 6.07 | Government |
| 1967 | 4th Assembly | Chandra Bhanu Gupta | 425 | 199 / 425 |
50 | 6,912,104 | 32.20 | 4.15 | Government |
| 1969 | 5th Assembly | Chandra Bhanu Gupta | 424 | 211 / 425 |
12 | 7,893,152 | 33.69 | 1.49 | |
| 1974 | 6th Assembly | Hemwati Nandan Bahuguna | 403 | 215 / 424 |
4 | 8,868,229 | 32.29 | 1.40 | Government |
| 1977 | 7th Assembly | 395 | 47 / 425 |
168 | 7,592,107 | 31.94 | 0.35 | Opposition | |
| 1980 | 8th Assembly | V. P. Singh | 424 | 309 / 425 |
262 | 9,720,767 | 37.65 | 5.71 | Government |
| 1985 | 9th Assembly | Narayan Datt Tiwari | 425 | 269 / 425 |
40 | 11,544,698 | 39.25 | 1.60 | Government |
| 1989 | 10th Assembly | Narayan Datt Tiwari | 410 | 94 / 425 |
175 | 10,866,428 | 27.90 | 11.35 | Opposition |
| 1991 | 11th Assembly | Narayan Datt Tiwari | 413 | 46 / 419 |
48 | 6,480,753 | 17.32 | 10.58 | Opposition |
| 1993 | 12th Assembly | 421 | 28 / 422 |
18 | 7,533,272 | 15.08 | 2.24 | Opposition | |
| 1996 | 13th Assembly | 126 | 33 / 424 |
5 | 4,626,663 | 8.35 | 6.73 | Opposition | |
| 2002 | 14th Assembly | Pramod Tiwari | 402 | 25 / 403 |
8 | 4,810,231 | 8.96 | 0.61 | Opposition |
| 2007 | 15th Assembly | Sonia Gandhi | 393 | 22 / 403 |
13 | 4,489,234 | 8.61 | 0.35 | Opposition |
| 2012 | 16th Assembly | Raj Babbar | 355 | 28 / 403 |
6 | 8,832,895 | 11.65 | 3.04 | Opposition |
| 2017 | 17th Assembly | 114 | 7 / 403 |
21 | 5,416,324 | 6.25 | 5.40 | Opposition | |
| 2022 | 18th Assembly | Priyanka Gandhi | 399 | 2 / 403 |
5 | 2,151,234 | 2.33 | 3.92 | Opposition |
| Year | General Election | Votes Polled | Seats Won | Seat Contested | Total Seats |
|---|---|---|---|---|---|
| 1951 | 1st Lok Sabha | 9,047,392 | 81 | - | 85 |
| 1957 | 2nd Lok Sabha | 10,599,639 | 70 | - | 85 |
| 1962 | 3rd Lok Sabha | 6,842,472 | 62 | - | 85 |
| 1967 | 4th Lok Sabha | 7,285,130 | 47 | - | 85 |
| 1971 | 5th Lok Sabha | 9,981,309 | 73 | - | 85 |
| 1977 | 6th Lok Sabha | 7,170,182 | 0 | - | 85 |
| 1980 | 7th Lok Sabha | 10,171,194 | 51 | - | 85 |
| 1984 | 8th Lok Sabha | 17,391,831 | 83 | - | 85 |
| 1989 | 9th Lok Sabha | 12,393,934 | 15 | - | 85 |
| 1991 | 10th Lok Sabha | 6,755,015 | 5 | - | 85 |
| 1996 | 11th Lok Sabha | 3,746,505 | 5 | - | 85 |
| 1998 | 12th Lok Sabha | 3,361,053 | 0 | - | 85 |
| 1999 | 13th Lok Sabha | 8,001,685 | 10 | - | 85 |
| 2004 | 14th Lok Sabha | 6,412,293 | 9 | - | 80 |
| 2009 | 15th Lok Sabha | data not available | 21 | - | 80 |
| 2014 | 16th Lok Sabha | data not available | 2 | 80 | |
| 2019 | 17th Lok Sabha | 54,57,269 | 1 | 67 | 80 |
Legislative Assembly Election
| Year | Assembly Election | Votes Polled | Seats Won | Seat Contested | Total Seats |
|---|---|---|---|---|---|
| 2002 | 1st Vidhan Sabha | 7,69,991 | 36 | 70 | 70 |
| 2007 | 2nd Vidhan Sabha | 1,116,511 | 21 | 70 | 70 |
| 2012 | 3rd Vidhan Sabha | 14,36,042 | 32 | 70 | 70 |
| 2017 | 4th Vidhan Sabha | 16,65,664 | 11 | 70 | 70 |
| 2022 | 5th Vidhan Sabha | 20,38,509 | 19 | 70 | 70 |
| Year | General Election | Votes Polled | Seats Won | Seat Contested | Total Seats |
|---|---|---|---|---|---|
| 2004 | 14th Lok Sabha | 1,024,062 | 1 | 5 | 5 |
| 2009 | 15th Lok Sabha | 1,354,468 | 5 | 5 | 5 |
| 2014 | 16th Lok Sabha | 1,494,440 | 0 | 5 | 5 |
| 2019 | 17th Lok Sabha | 15,20,767 | 0 | 5 | 5 |
Legislative Assembly Elections
| Year | Assembly Election | Votes Polled | Seats Won | Seat Contested | Total Seats |
|---|---|---|---|---|---|
| 1951 | 1st Assembly | 2,889,994 | 150 | 236 | 238 |
| 1957 | 2nd Assembly | 4,830,992 | 152 | 251 | 252 |
| 1962 | 3rd Assembly | 4,522,476 | 157 | 252 | 252 |
| 1967 | 4th Assembly | 5,207,930 | 127 | 280 | 280 |
| 1969 | 5th Assembly | 5,538,622 | 55 | - | 280 |
| 1971 | 6th Assembly | 3,767,314 | 105 | - | 280 |
| 1972 | 7th Assembly | 6,543,251 | 216 | - | 280 |
| 1977 | 8th Assembly | 3,298,063 | 20 | - | 294 |
| 1982 | 9th Assembly | 8,035,272 | 49 | 250 | 294 |
| 1987 | 10th Assembly | 10,989,520 | 40 | 294 | 294 |
| 1991 | 11th Assembly | 10,875,834 | 43 | 284 | 294 |
| 1996 | 12th Assembly | 14,523,964 | 82 | 288 | 294 |
| 2001 | 13th Assembly | 2,921,156 | 26 | 60 | 294 |
| 2006 | 14th Assembly | - | 21 | 262 | 294 |
| 2011 | 15th Assembly | - | 42 | 65 | 294 |
| 2016 | 16th Assembly | 6,700,938 | 44 | 92 | 295 |
| 2021 | 17th Assembly | 1,757,131 | 0 | 91 | 294 |
| Year | General Election | Votes Polled | Seats Won | Seat Contested | Total Seats |
|---|---|---|---|---|---|
| 1951 | 1st Lok Sabha | 3,205,162 | 24 | - | |
| 1957 | 2nd Lok Sabha | 5,031,696 | 23 | - | |
| 1962 | 3rd Lok Sabha | 4,553,677 | 22 | - | |
| 1967 | 4th Lok Sabha | 5,105,170 | 14 | - | |
| 1971 | 5th Lok Sabha | 3,687,665 | 13 | - | |
| 1977 | 6th Lok Sabha | 4,312,418 | 3 | - | |
| 1980 | 7th Lok Sabha | 7,500,578 | 4 | - | |
| 1984 | 8th Lok Sabha | 12,227,863 | 16 | - | |
| 1989 | 9th Lok Sabha | 13,100,945 | 4 | - | |
| 1991 | 10th Lok Sabha | 10,834,675 | 5 | - | |
| 1996 | 11th Lok Sabha | 14,711,538 | 9 | - | |
| 1998 | 12th Lok Sabha | 5,551,456 | 1 | - | |
| 1999 | 13th Lok Sabha | 4,688,932 | 3 | - | 42 |
| 2004 | 14th Lok Sabha | 5,385,754 | 6 | - | 42 |
| 2009 | 15th Lok Sabha | - | 6 | - | 42 |
| 2014 | 16th Lok Sabha | - | 4 | - | 42 |
| 2024 | 18th Lok Sabha | 1 | 13 | 42 |
| Year | General Election | Votes Polled | Seats Won | Seat Contested | Total Seats |
|---|---|---|---|---|---|
| 1951 | 1st Assembly | 104,411 | 20 | 30 | 30 |
| 1951 | 1st Lok Sabha | 89,761 | 2 |
| Year | General Election | Votes Polled | Seats Won | Seat Contested | Total Seats |
|---|---|---|---|---|---|
| 1951 | 1st Assembly | 117,656 | 25 | 28 | 30 |
| 1951 | 1st Lok Sabha | 97,292 | 2 |
| Year | General Election | Votes Polled | Seats Won |
|---|---|---|---|
| 1951 | 1st Assembly | 5,556,334 | 269 |
| 1951 | 1st Lok Sabha | 5,781,277 | 40 |
| 1957 | 2nd Assembly | 8,131,604 | 234 |
| 1957 | 2nd Lok Sabha | 8,156,272 | 38 |
| Year | General Election | Votes Polled | Seats Won | Seat Contested | Total Seats |
|---|---|---|---|---|---|
| 1951 | 1st Assembly | 48,845 | 15 | 24 | 24 |
| 1951 | 1st Lok Sabha | 38,063 | 1 |
| Year | General Election | Votes Polled | Seats Won |
|---|---|---|---|
| 1951 | 1st Lok Sabha | 78,771 | 2 |
| Year | General Election | Votes Polled | Seats Won | Seat Contested | Total Seats |
|---|---|---|---|---|---|
| 1951 | 1st Assembly | 938,918 | 75 | 99 | 99 |
| 1951 | 1st Lok Sabha | 992,159 | 9 |
Patiala and East Punjab States Union
| Year | General Election | Votes Polled | Seats Won | Seat Contested | Total Seats |
|---|---|---|---|---|---|
| 1951 | 1st Assembly | 388,185 | 26 | 51 | 60 |
| 1951 | 1st Lok Sabha | 492,408 | 2 | ||
| 1954 | 2nd Assembly | 696,979 | 37 |
| Year | General Election | Votes Polled | Seats Won |
|---|---|---|---|
| 1951 | 1st Assembly | 606,934 | 55 |
| 1951 | 1st Lok Sabha | 506,112 | 6 |
| Year | General Election | Votes Polled | Seats Won | Seat Contested | Total Seats |
|---|---|---|---|---|---|
| 1951 | 1st Assembly | 270,013 | 40 | 56 | 60 |
| 1951 | 1st Lok Sabha | 238,220 | 4 | ||
| 1957 | 2nd Lok Sabha | 253,241 | 1 |
- ^ The Representative Assembly was converted into the Legislative Assembly of Pondicherry on 1 July 1963 and its members were deemed to have been elected to the Assembly.[5]: 966 Thus, the First Legislative Assembly was formed without an election. Elections for the assembly have been held since 1964.
- ^ "Election Commission of India".
- ^ "Election Commission of India".
- ^ "Election Commission of India".
- ^ "Election Commission of India".
- ^ Cabinet Responsibility to Legislature. Metropolitan Book Co. Pvt. Ltd. 1964. p. 464. ISBN 9788120004009.